
Your Pay ‘Almost Kept Up’ With Inflation. Your Bills Didn’t.

Illustration · image created for this article
Here is a comforting sentence: since the end of 2019, average full-time earnings in Australia rose 25.6%, the minimum wage rose 25.8%, and consumer prices rose 26.8%. Near enough to a draw. Case closed, nothing to see here.
Now open the basket. The CPI is an average, and an average is a blender. It throws insurance (+54.3%) into the same jug as televisions (−2.8%), whirs it for six and a half years, and pours out one tidy number. Using the latest ABS data to June 2026, this article answers one question properly: have wages actually kept up with inflation? The honest answer depends on which wage you mean, which bill you pay, and which statistician you ask.
Cost of living vs wages: the scoreboard, in short
- Period
- December quarter 2019 (last pre-COVID quarter) → June quarter 2026
- Prices (CPI)
- +26.8% (ABS 6401.0, Tables 17/18)
- Wage rates (WPI)
- +20.8% (ABS 6345.0, Table 1)
- Avg full-time earnings (AWOTE)
- +25.6% · $1,658.40 → $2,083.70/week (ABS 6302.0)
- National minimum wage
- +25.8% · $753.80 → $948.00/week (FWC reviews)
- Real WPI
- ≈ −4.4% vs pre-COVID (derived calculation on ABS index levels)
- Inflation peak
- 7.8% in the year to Dec 2022 — highest since 1990. The price level never fell; only the speed did.
- Median household income
- Last data $959/week (2019-20); next release mid-2027
Sources: ABS 6401.0 / 6345.0 / 6302.0; Fair Work Ombudsman annual wage reviews. The minimum-wage window runs July to July, not quarter to quarter.
Wages vs inflation: three measures, three answers
Australia has three mainstream wage measures, and they give three different answers. This is the part most commentary skips, because “it depends” doesn’t trend. The Wage Price Index is the ABS’s headline measure and the one the RBA leans on: it tracks pure hourly wage rates, holding the job mix constant — the cleanest read on what a given job now pays. AWOTE, average weekly ordinary-time earnings for full-time adults, is an average: it captures promotions, job-switching and the changing composition of who works full-time, not just pay rises. It flatters.
| Measure | What it tracks | Cumulative | Real vs Dec 2019 |
|---|---|---|---|
| WPI (ABS headline) | Hourly rates, fixed job basket | +20.8% | ≈ −4.4% |
| AWOTE | Avg full-time weekly earnings | +25.6% | ≈ −0.9% (flat) |
| RBA AENA | Nat-accounts earnings/hour, incl. bonuses | — | above pre-pandemic |
Real figures are derived: ABS wage indexes deflated by the ABS CPI. The ABS publishes no real-wage series.
“Real WPI declined steadily as inflation outpaced wages growth and remains below its pre-pandemic level… Real AENA… has since recovered and remains above its pre-pandemic level.”
Reserve Bank of Australia — speech, 22 September 2026
Both halves of that quote are true; they just measure different things. And the path matters as much as the endpoint: real WPI bottomed out at about −5.1% in mid-2023, recovered to around −4.0% by December 2025, then slipped back to roughly −4.4% at June 2026. The recovery is partial and, on the latest data, has stalled. Anyone quoting exactly one of the three measures is telling you a third of the story.
Derived: ABS WPI deflated by ABS CPI (seasonally adjusted). Anchor points from ABS index levels; the line between them is indicative.
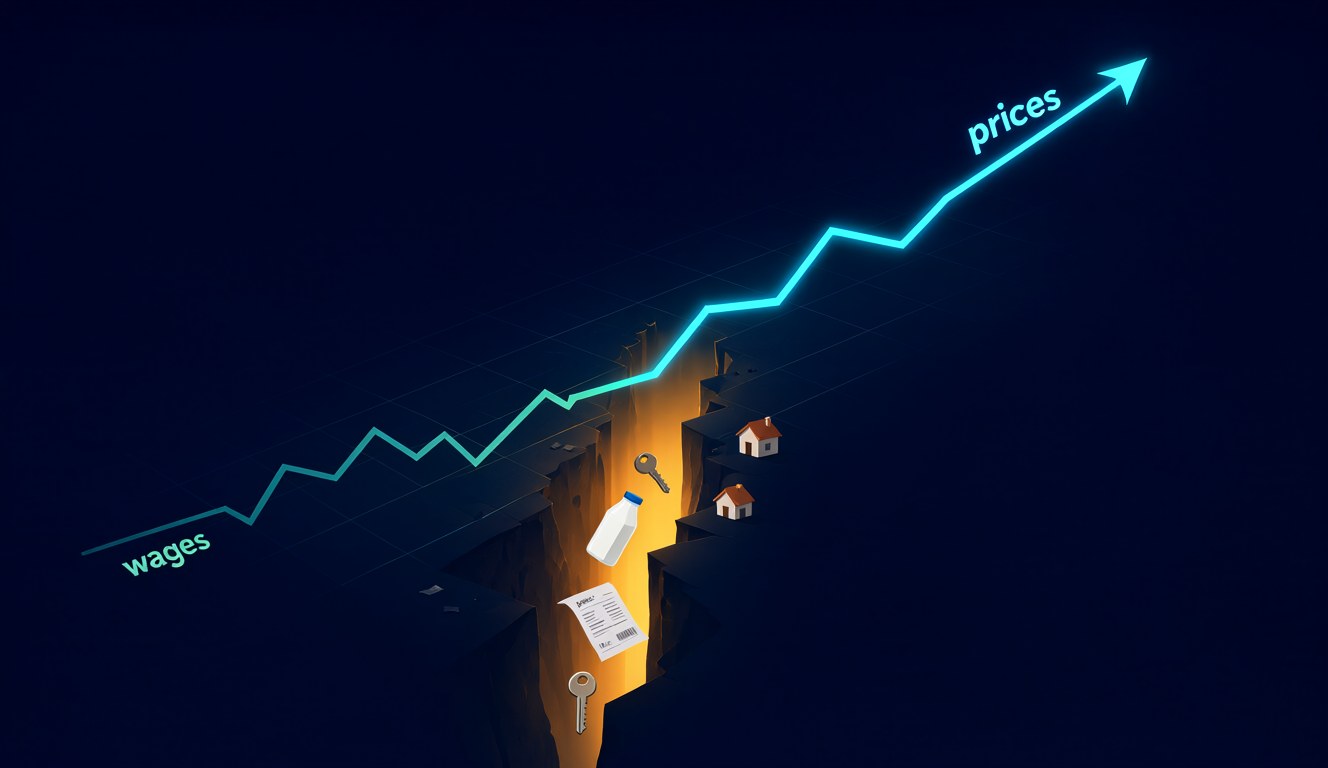
Illustration · image created for this article
Opening the basket
The CPI blends everything Australians buy into one number. That is useful for indexation and terrible for describing lived experience, because the components moved in opposite directions. Here is the ladder — cumulative price change from the December quarter 2019 to the June quarter 2026, derived from ABS Table 18 index levels:
Derived from ABS CPI Table 18 index levels (weighted average of eight capital cities), Dec qtr 2019 → Jun qtr 2026. Not an ABS-published statistic. *Electricity is rebate-distorted — see below.
What ran hot is what you can’t skip
Look at the top of that ladder. Insurance. The cost of putting a roof over your head. Gas. School fees. The doctor. Groceries. Every essential outran the average, and therefore outran the wage index. Drill into food (also derived, same endpoint): coffee, tea and cocoa +38.7%. Milk +35.2%. Bread +32.9%. Fruit +30.8%. Takeaway and fast food +29.9%. Even meat and seafood, the laggard, rose +25.5%.
The food aisle, item by item
| Item | Cumulative change | vs CPI (+26.8%) |
|---|---|---|
| Coffee, tea & cocoa | +38.7% | ▲▲ well above |
| Milk | +35.2% | ▲▲ well above |
| Bread | +32.9% | ▲▲ well above |
| Fruit | +30.8% | ▲ above |
| Takeaway & fast food | +29.9% | ▲ above |
| Meat & seafood | +25.5% | ▼ just below |
Derived from ABS CPI Table 18 index levels, Dec qtr 2019 → Jun qtr 2026. Not an ABS-published statistic.
The honest caveats: the ladder mixes granularity (insurance and rents are expenditure classes, housing and food are broader groups), and electricity is distorted by the Energy Bill Relief Fund — the rebates pushed the index down 8.4% in the December 2025 quarter, then it rebounded +22.2% over the first half of 2026 as they unwound. The +28.0% is the net of that whiplash. Even so, the pattern doesn’t depend on any one line.
Now look at what got cheaper: audio-visual gear and public transport fares. A cheaper television is nice. It does not offset a 54% insurance bill, because you buy a TV once a decade and insurance every month. Nobody has ever cancelled their contents cover and felt rich because headphones were on special. This is why the experienced cost of living in Australia in 2026 feels higher than 26.8% — for a household whose budget leans toward the top of the ladder, it is. The average isn’t wrong; it’s just not about you.
The missing middle
There is one number that would settle the argument, and Australia doesn’t have it. The ABS’s best measure of how the typical household lives — median equivalised disposable income from the Survey of Income and Housing — was $959 a week in 2019-20. That is the most recent figure in existence. The 2020-21 and 2021-22 surveys were cancelled for COVID. The 2023-24 survey was run across roughly 30,000 households, and then the ABS cancelled the release on 17 July 2025, citing “serious shortcomings in the questionnaire design and data collection processes.” The next data point is due mid-2027.

Illustration · image created for this article
So anyone who claims to know how the median household has fared since 2020 is working from a non-ABS estimate. The closest official proxy is the RBA’s assessment from February 2025 that real household disposable income per capita was “around 1 per cent lower than prior to the pandemic” — labour income contributed about +4 percentage points since December 2019, while higher interest, tax and lower mixed income subtracted about 5. That analysis is now more than 18 months old, and the August 2026 Statement on Monetary Policy no longer restates it.
“Real wages grew by 0.2 per cent in the quarter, but fell by 0.8 per cent in unrounded through the year terms.”
Treasury — 19 August 2026
The central bank and the Treasurer’s department are reading the same stalled recovery.
What it means in dollars
Strip the percentages back to a grocery bag. Take $1,000 of spending in December 2019. That basket now costs $1,268. An hourly wage that rose with the WPI turned $1,000 of pay into $1,208 of purchasing power. The gap is $60 for every $1,000 you spend — call it $60 a month on a $1,000 monthly basket, more if your spending leans on insurance, housing and food, less if you live on discounted televisions.
| Item | Dec 2019 | Jun 2026 | Gap |
|---|---|---|---|
| A $1,000 basket of goods and services | $1,000 | $1,268 | — |
| Purchasing power of $1,000 of WPI-indexed pay | $1,000 | $1,208 | −$60 per $1,000 spent |
Derived: $1,000 × 1.268 (CPI) vs $1,000 × 1.208 (WPI). Households heavier in insurance, housing and food sit above the $60 figure.
Sixty dollars doesn’t sound like a crisis. That’s the point of averages: they turn a slow squeeze into background noise. But $60 a month, every month, compounding for six and a half years, is how a buffer quietly becomes a balance.
So — did your pay keep up?
- Prices: +26.8% since pre-COVID. Insurance, new housing, gas and food ran far hotter. Electronics and public transport fares fell.
- Hourly wage rates: +20.8%. Behind prices, leaving real wages about 4.4% lower than pre-COVID on the ABS’s headline measure — with a trough of −5.1% in mid-2023, a recovery to −4.0% by December 2025, and a slip back by June 2026. The recovery has stalled.
- Average full-time earnings: +25.6%. Roughly flat in real terms, helped by composition effects an index strips out.
- The median household: unmeasurable. The last ABS data is 2019-20; the next is mid-2027. Treat any confident claim in between with suspicion.
- Be precise. “Real wages have recovered” is true for national-accounts average earnings including bonuses, false for the WPI, and a coin toss for AWOTE. The honest sentence: wages vs inflation in Australia ended in a near-draw on average, and a clear loss on the bills you can’t avoid.
The bottom line: your pay didn’t fall behind in one dramatic year — it fell behind slowly, in the line items you can’t cancel, while the average said everything was fine. That isn’t a scandal; it’s arithmetic. But arithmetic is exactly what makes it worth saying out loud — and worth checking again when the September quarter WPI lands in November.
Questions, answered
Have wages kept up with inflation in Australia?
Depends on the measure. The Wage Price Index rose 20.8% versus CPI’s 26.8% from December 2019 to June 2026 — a real fall of about 4.4%. AWOTE, the average full-time earnings measure, rose 25.6%, roughly flat after inflation. The RBA’s broader earnings measure is above pre-pandemic. Pick one number and you’re telling a third of the story.
Which costs rose the most since 2019?
Insurance (+54.3%), new dwellings for owner-occupiers (+46.7%) and gas (+44.2%) top the ladder, with housing, education, health and food all above the 26.8% average. The fallers were audio-visual equipment (−2.8%) and urban transport fares (−12.1%).
What’s the difference between the WPI and AWOTE?
The WPI tracks hourly wage rates for a fixed basket of jobs — the purest read on pay growth, and the ABS’s headline. AWOTE is the average of what full-time adults actually earned in a survey week, so it moves with promotions, job-switching and workforce composition as well as pay rises. The WPI is cleaner; AWOTE is louder.
What was the inflation peak?
7.8% in the year to the December quarter 2022 — the ABS called it the highest since 1990. An “8.4%” figure circulates but can’t be verified against any ABS headline series. And note: the rate peaked; the price level never came back down.
Did the minimum wage keep up?
Nearly. It rose 25.8%, from $753.80 to $948.00 a week, against CPI’s 26.8% — though the windows don’t match exactly (award changes take effect each July, CPI is quarterly).
When will we know what happened to median incomes?
Mid-2027, when the ABS expects results from the 2025-26 Survey of Income and Housing. Until then, the most recent Australian median household income data is $959 a week from 2019-20.
What to watch next
- September quarter WPI (due November 2026): does real WPI slip further below −4.4%, or finally climb?
- Monthly CPI, August 2026: already at +4.0% year on year — the re-acceleration is real.
- December 2026 electricity: the rebate unwind finishes; watch the true rate surface.
- Mid-2027, the SIH: the first post-COVID median household income figure. The empty frame finally gets a picture.
- The RBA’s next restatement of real household income — the February 2025 assessment is now well past its use-by date.
Sources
- ABS — Consumer Price Index, Australia (6401.0), June quarter 2026
- ABS — Wage Price Index, Australia (6345.0), June quarter 2026
- ABS — Average Weekly Earnings, Australia (6302.0), May 2026
- ABS — Household Income and Wealth (Survey of Income and Housing), 2019-20
- ABS media statement — Survey of Income and Housing results will not be released
- ABS information paper — Re-referencing the quarterly CPI
- RBA — Statement on Monetary Policy, February 2025, Box B
- RBA speech — A Wage-price Spiral: What are the Chances?
- Treasury — Wages continue to grow under Labor
- Fair Work Ombudsman — Annual Wage Review decisions 2020–2025
Not financial advice. This article is general commentary on publicly released data from the Australian Bureau of Statistics, the Reserve Bank of Australia, Treasury and the Fair Work Commission, written on 2 October 2026. All cumulative category and real-wage percentages are derived calculations on ABS-published index levels, not ABS-published statistics; rounded index numbers can produce small differences in user calculations. Median household income figures stop at 2019-20 because that is the latest data the ABS has released. This page will not update automatically.
Found this useful?
Buy me a coffee ☕
Everything here is free and ad-free. A coffee or a AU$1/month membership keeps new articles, games and tools coming.
Also in the shop: VoidFill · The Architect’s Monologue · Brisbane photo prints