
Australia’s Trade Surplus Just Shrank to $495m. Here’s What Ate It.
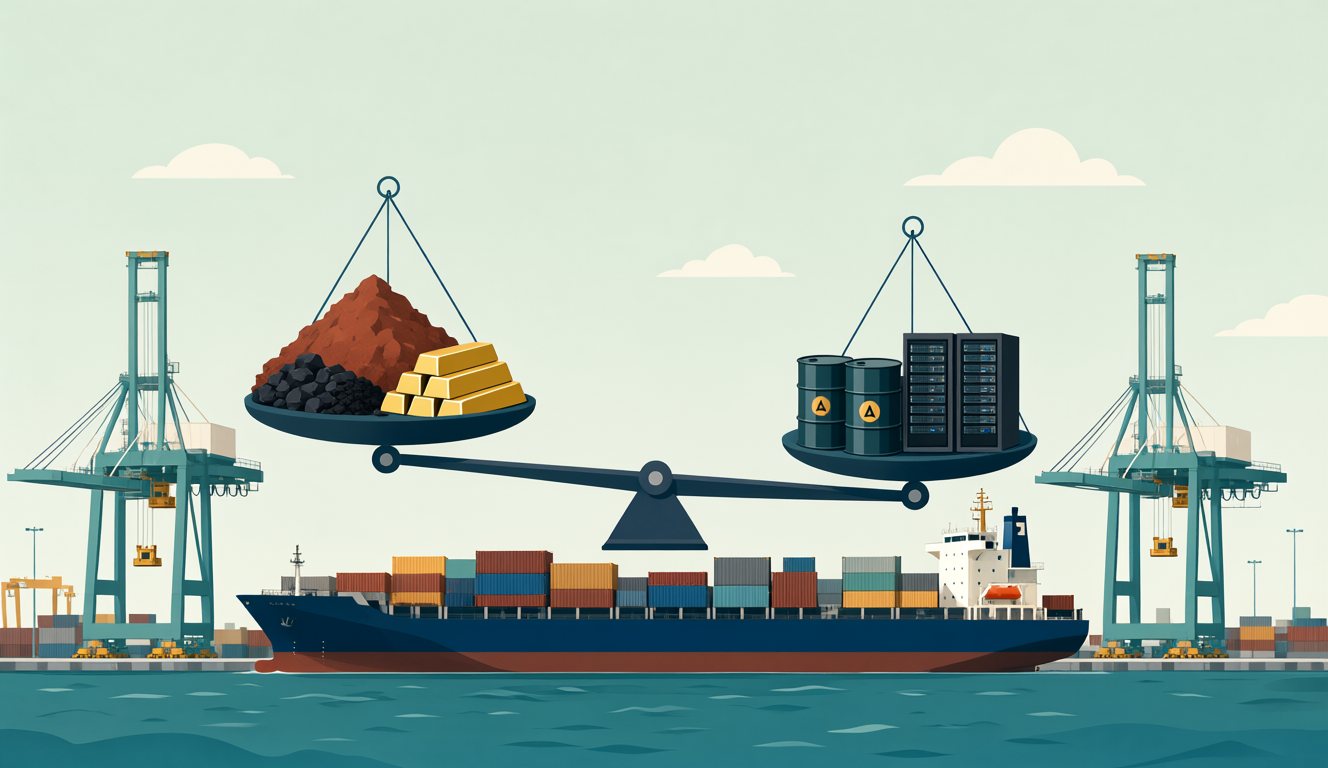
Illustration · image created with Qwen Image 2.1 for this article
Australia still sells the world more goods than it buys — but only just. In August 2026 the goods trade surplus fell to $495 million, down from $1,351 million in July and $1,962 million in June (ABS, seasonally adjusted, released 1 October 2026). Exports rose. Imports rose faster.
Two things did most of the eating: computers (capital goods imports jumped 22.3% in one month as the AI and data-centre build-out pulls in servers) and expensive fuel (diesel cost 57% more per unit than a year ago). The same fuel bill is why August’s CPI jumped to 4.0%. This page walks through the numbers, then answers what it means for prices and interest rates.
Australia’s trade balance, in short
- Goods surplus
- $495m · down $856m from July
- Exports
- $47,433m · +3.7% (gold, coal)
- Imports
- $46,938m · +5.8% (computers, gold)
- Capital goods imports
- $10,798m → $13,208m (+22.3%)
- Consumption goods imports
- −7.0% · households buying less
- Iron ore
- volumes up 5–11% y/y, prices down 14–15% y/y
- Fuel import prices (y/y)
- crude +21.7% · petrol +31.6% · diesel +57.0% · jet fuel +61.5%
- Source
- ABS, International Trade in Goods, Aug 2026 (seasonally adjusted, released 1 Oct 2026)
Source: ABS, International Trade in Goods, August 2026, Table 1. The surplus fell by about 75% in two months.
Why did Australia’s trade surplus fall in August 2026?
Short answer: exports grew by $1,707m, but imports grew by $2,563m. The gap between the two, $856m, is exactly how much the surplus shrank.
| $ million (sa) | Jun 26 | Jul 26 | Aug 26 | Jul → Aug |
|---|---|---|---|---|
| Balance on goods | 1,962 | 1,351 | 495 | −856 |
| Exports (credits) | 47,411 | 45,726 | 47,433 | +1,707 (+3.7%) |
| Imports (debits) | 45,449 | 44,375 | 46,938 | +2,563 (+5.8%) |
Imports are shown as positive numbers for readability; the ABS publishes them as debits (negative).
One warning before reading too much into a single month: gold swings these numbers around. Gold exports rose 20.2% and gold imports rose 91.1% in August. Strip gold out and look only at general merchandise, and exports rose just 1.6% while imports rose 2.5% — still a squeeze, just a quieter one.
What pushed imports up? Computers for the AI build-out
Short answer: capital goods. Businesses imported $13.2 billion of machinery and equipment in August, up from $10.8 billion, and the ABS names automatic data processing equipment — computers and servers — as the main driver.
Source: ABS, International Trade in Goods, August 2026 (seasonally adjusted). Gold imports (+91.1%) are left out because they would swamp the chart.
This is the same story playing out everywhere in 2026: companies are racing to build AI capacity, and Australia doesn’t make the servers that fill a data centre. In its September decision the RBA even listed AI-driven price rises in global tech goods as one of the inflation pressures it is watching. In the long run that equipment should make the economy more productive. In the short run it is a cheque written to overseas suppliers, and it shows up as a smaller trade surplus.
The other half of the chart matters just as much. Consumption goods imports fell 7.0% — fewer cars, clothes, appliances and toys coming in. Households facing four rate rises this year are buying less, and that is exactly the slowdown the Reserve Bank has been trying to cause.
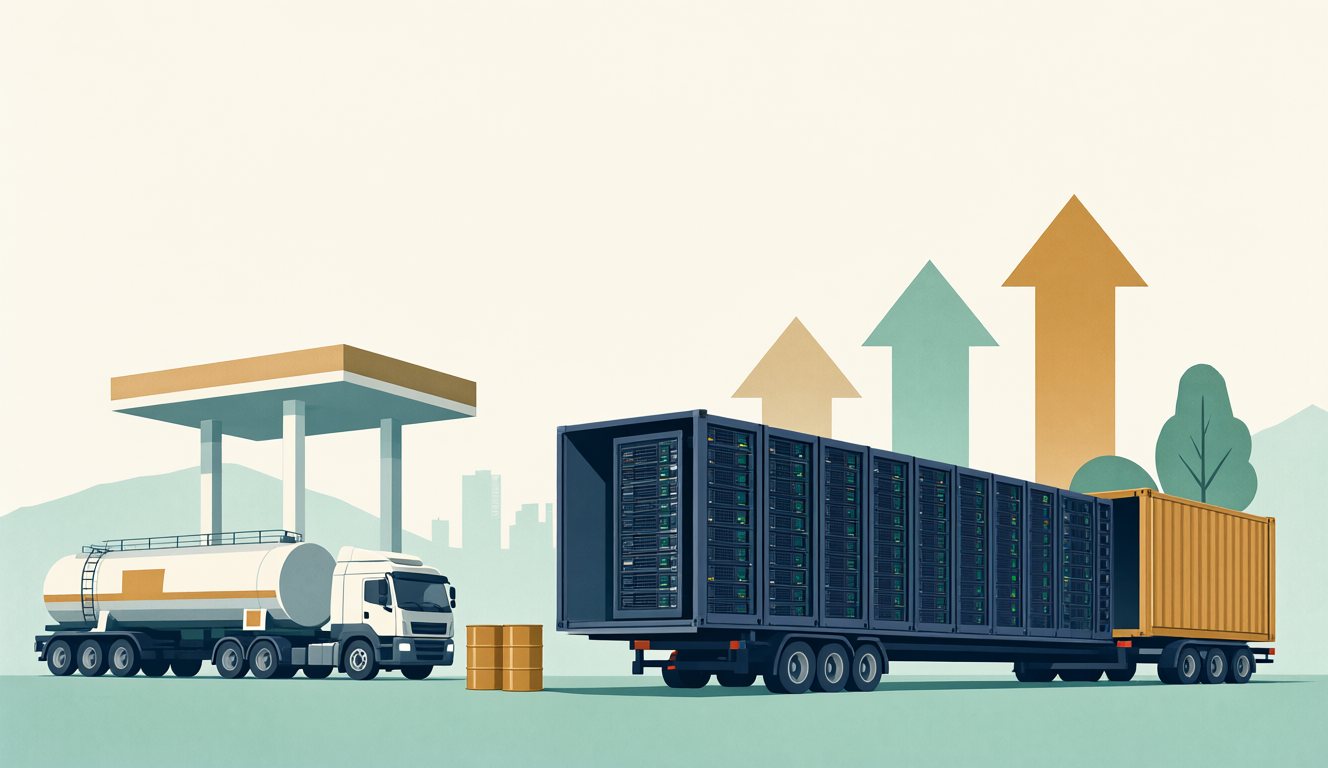
Illustration · image created with Qwen Image 2.1 for this article
Are Australia’s exports still strong?
Short answer: by volume, yes; by price, less so. We are shipping more iron ore and coal than a year ago, but iron ore — our biggest export — now earns about 15% less per tonne.
| Export, Aug 2026 | Volume y/y | Price per unit y/y |
|---|---|---|
| Iron ore — lump | +11.0% | −15.2% |
| Iron ore — fines | +4.5% | −14.3% |
| Hard coking coal | +13.0% | +14.9% |
| Thermal coal | +11.0% | +14.7% |
| LNG (gas) | +10.8% | +13.0% |
Source: ABS, International Trade in Goods, August 2026, selected commodity quantities and unit values (original series, year-on-year change).
That split is the quiet risk in the data. Strong iron ore volumes are hiding weaker prices, so the money flowing back to Australia from its largest export is growing much more slowly than the tonnes. Coal and gas are doing the opposite: higher prices and higher volumes, a side effect of the same global energy squeeze that is making our fuel dearer. If China’s steel demand slips, the volume cushion under iron ore goes too.
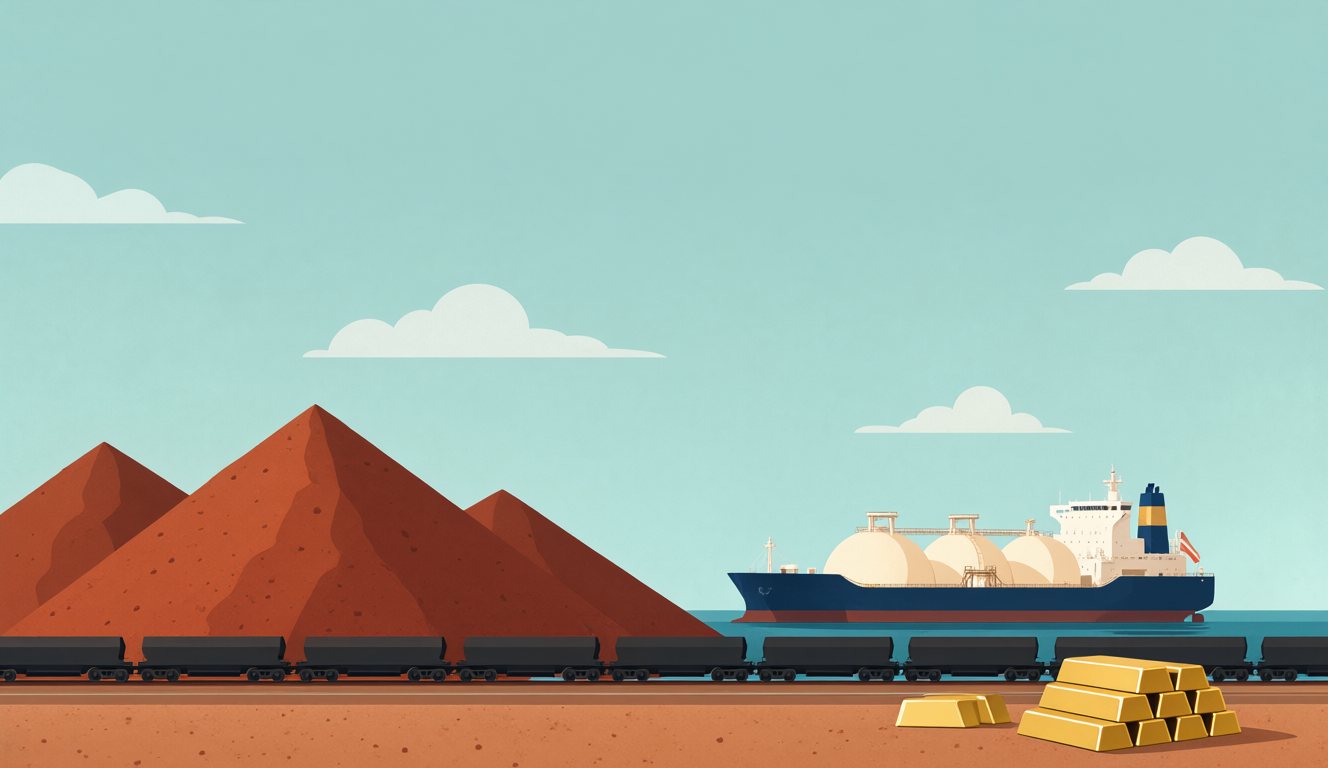
Illustration · image created with Qwen Image 2.1 for this article
Why are petrol and diesel so expensive in Australia right now?
Short answer: Australia imports most of its refined fuel, and import prices are up 22–62% on a year ago after Middle East supply disruptions. That flows straight to the bowser.
Source: ABS, International Trade in Goods, August 2026, selected import unit values (year-on-year change). Import volumes of crude, diesel and jet fuel fell over the same year.
You can see the same shock in the August CPI. Transport prices jumped 4.2% in a single month and are 5.6% higher than a year ago, the biggest single reason headline inflation rose from 3.5% to 4.0%. Diesel matters more than most people think: it moves every truckload of groceries, so dearer diesel tends to show up on supermarket shelves a few months later. (My weekly Coles vs Woolworths price comparison is a good place to watch for that.)
| August 2026 CPI | Month | Year |
|---|---|---|
| All groups (headline) | +0.4% | +4.0% |
| Trimmed mean (the RBA’s focus) | +0.2% | +3.6% |
| Transport | +4.2% | +5.6% |
| Housing | +0.2% | +5.7% |
| Non-discretionary (essentials) | +0.9% | +4.7% |
| Discretionary | −0.2% | +3.0% |
Source: ABS, Consumer Price Index, Australia, August 2026 (monthly change original, annual change original; weighted average of eight capital cities).
The gap between essentials (+4.7%) and discretionary spending (+3.0%) is the part that hurts. You can delay a new TV; you can’t delay filling the car or paying rent. Hobart (4.8%) and Adelaide (4.7%) had the highest inflation of the capitals in August; Melbourne the lowest at 3.5%.

Illustration · image created with Qwen Image 2.1 for this article
What does this mean for interest rates?
Short answer: it keeps another rise on the table. The RBA lifted the cash rate to 4.60% on 29 September, its fourth rise of 2026, and Governor Bullock kept the November meeting “live”. The quarterly CPI on 28 October is the deciding number.
The trade data gives the Reserve Bank something for both sides of the argument. For another hike: fuel is keeping headline inflation at 4.0%, and the trimmed mean has been stuck at 3.6% for two months, above the 2–3% target. Against: households are already pulling back (consumption imports −7.0%), and private-sector job vacancies fell 2.0% in the three months to August, to 286,300, while the total held up only because public-sector vacancies rose 7.8%.
For a household with a $600,000 variable mortgage, each 0.25-point rise adds roughly $97–99 a month, and this year’s four rises add about $400 a month together. Most bank economists, including CBA, don’t expect cuts until the second half of 2027. That is a forecast, not a promise: it depends on fuel prices easing.
I covered the rate decision itself in RBA raises the cash rate to 4.60%, and why fuel and housing keep inflation sticky in wages vs inflation since 2019.
The bottom line
- The surplus is thin, not gone. $495m is the smallest of the last three months and about a quarter of June’s. One gold-heavy month can swing it either way.
- Computers are the new import story. Capital goods imports +22.3% in a month, led by data-processing equipment: the AI build-out, paid for overseas.
- Fuel is the inflation story. Diesel import prices +57% y/y feed transport CPI (+5.6%) and keep headline inflation at 4.0%.
- Iron ore is earning less per tonne. Volumes up, prices down about 15% y/y. Watch China.
- Households are already cutting back. Consumption goods imports −7.0% and private job vacancies −2.0%: the rate rises are working, slowly.
Questions, answered
What was Australia’s trade balance in August 2026?
Australia recorded a goods trade surplus of $495 million in August 2026 (seasonally adjusted), down $856 million from $1,351 million in July, according to the ABS release of 1 October 2026. Exports rose 3.7% to $47,433 million and imports rose 5.8% to $46,938 million.
Why did Australia’s trade surplus shrink?
Imports grew faster than exports. Capital goods imports jumped 22.3% in August 2026, led by computer and data-processing equipment for the AI and data-centre build-out, and gold imports rose 91.1%. Exports grew 3.7%, mainly on gold and coal.
Why is diesel so expensive in Australia in 2026?
Australia imports most of its refined fuel, and diesel import prices were 57% higher per unit in August 2026 than a year earlier after Middle East supply disruptions. Jet fuel import prices rose 61.5%, petrol 31.6% and crude oil 21.7%. Transport prices in the CPI rose 5.6% over the year.
Is iron ore still Australia’s biggest export, and is it doing well?
Iron ore remains Australia’s largest export. In August 2026 export volumes were up 4.5% to 11% on a year earlier, but unit prices were down about 14% to 15%, so earnings are growing much more slowly than tonnes shipped.
Will the RBA raise interest rates again in November 2026?
It is possible. The RBA raised the cash rate to 4.60% on 29 September 2026 and kept the November meeting live. Headline CPI was 4.0% and trimmed mean 3.6% in August, above the 2-3% target. The quarterly CPI due on 28 October 2026 is the key input. This is general information, not financial advice.
What to watch next
- 28 October 2026 — quarterly CPI. If the trimmed mean stays near 3.6%, a fifth rate rise becomes much more likely.
- November 2026 — the RBA meeting. Markets were pricing roughly a one-in-three chance of a hike after the September decision.
- Early November — September trade data. Do capital goods imports stay high, and do fuel import prices start to ease?
- Iron ore prices. Another month of falling prices would put real pressure on the surplus and on the federal budget.
Sources
- ABS — International Trade in Goods, Australia, August 2026
- ABS — Consumer Price Index, Australia, August 2026
- ABS — Job Vacancies, Australia, August 2026
- Reserve Bank of Australia — Monetary Policy Decision, 29 September 2026
- Commonwealth Bank of Australia economics — rate forecasts, 2026
Not financial advice. General commentary on data published by the Australian Bureau of Statistics and the Reserve Bank of Australia, written on 6 October 2026. The figures were compiled with AI assistance from the ABS releases listed above and checked against them; bank forecasts are forecasts. Trade figures are seasonally adjusted unless stated and may be revised in later releases. This page will not update automatically.
Found this useful?
Buy me a coffee ☕
Everything here is free and ad-free. A coffee or a AU$1/month membership keeps new articles, games and tools coming.
Series: Australian Economy 2026 (part 7 of 7)系列:2026 澳洲經濟(第 7 / 7 篇)
Rates, wages, housing and prices: what the 2026 numbers mean for Australian households.利率、工資、樓價與物價:2026 年的數字對澳洲家庭意味著甚麼。
- Will the RBA Raise Rates? Australia's Jobs and Inflation儲備銀行會加息嗎?澳洲就業與通脹
- RBA Raises the Cash Rate to 4.60%儲備銀行加息至 4.60%
- Wages vs Inflation 2019–2026: CPI +26.8%, WPI +20.8%工資對通脹 2019–2026
- Negative Gearing & CGT Reform: House Prices in Every Capital負扣稅與資本增值稅改革:各首府房價
- Card Surcharge Ban: Who Really Pays Now?禁止刷卡附加費:誰在埋單?
- University vs TAFE: Who Goes Where After Year 12?大學定 TAFE?中學畢業生去向
- Trade Surplus Falls to $495m: Computers, Fuel and Iron Ore貿易順差跌至4.95億:電腦、燃油與鐵礦石