
Inflation Hit 4.3% in September. Why I Now Expect the RBA to Hike on 3 November
Illustration generated with Qwen Image 2.1
Australian prices rose 4.3% in the year to September 2026, up from 4.0% in August. The trimmed mean, the measure the Reserve Bank watches most, rose to 3.6%, and prices rose 1.3% in the September quarter alone. The ABS released the figures this morning, six days before the RBA’s next decision.
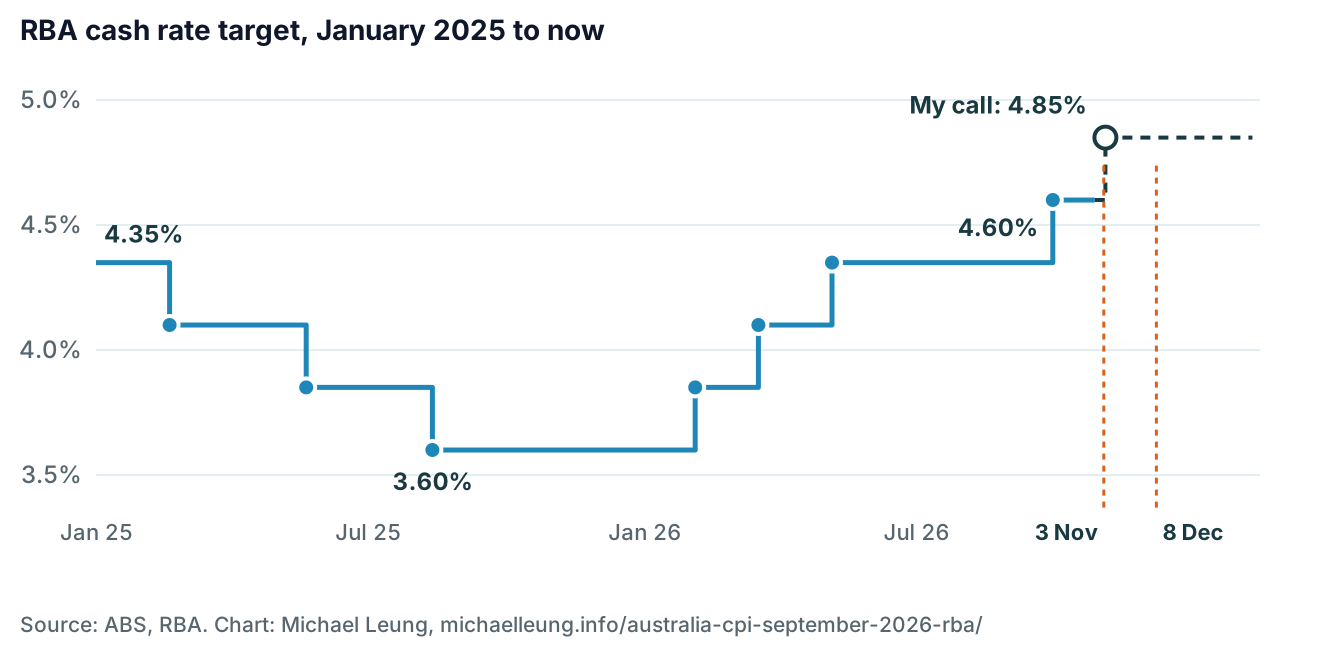
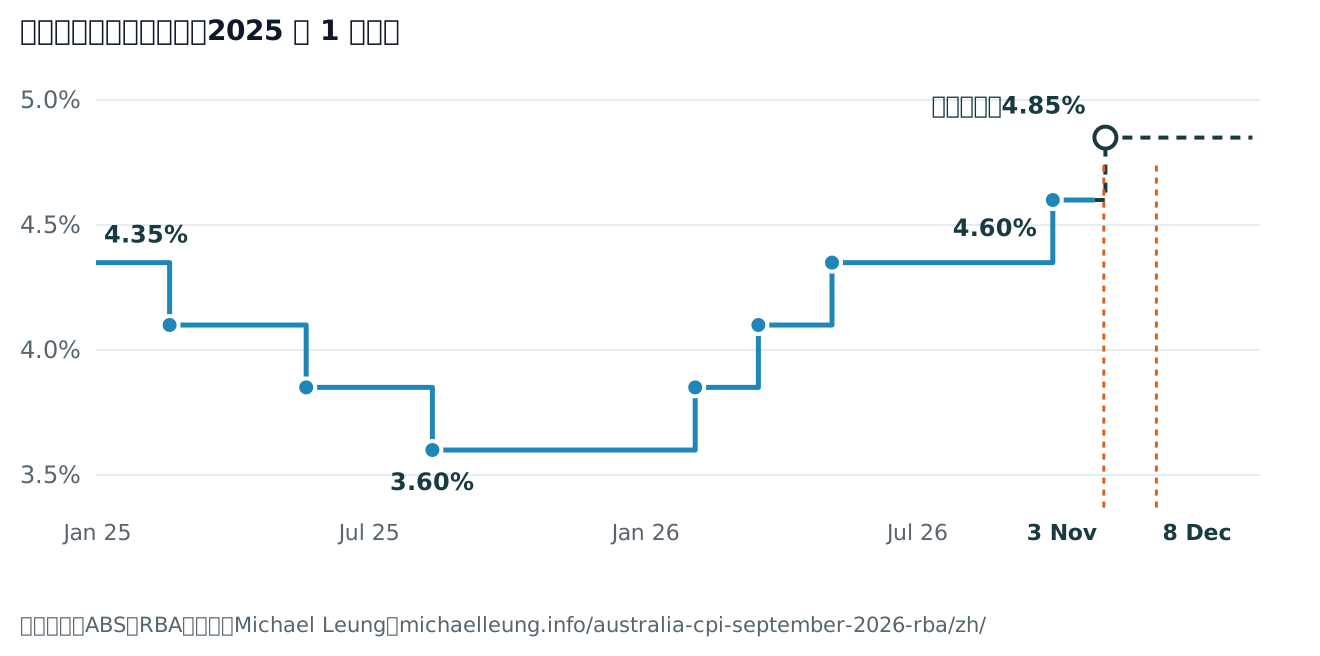
Two weeks ago, in part 11, I said the RBA would hold in November. This print changes my call. Using only ABS and RBA figures, I now expect a 0.25-point rise to 4.85% on 3 November (about a 60% chance in my view), with a hold the main alternative.
September CPI in short
- Headline CPI
- 4.3% in the year to September 2026 (August 4.0%). Target: 2–3%.
- Underlying
- Trimmed mean 3.6%, weighted median 3.4%, CPI without fuel and fruit and vegetables 3.7%
- September quarter
- CPI +1.3%, trimmed mean +1.0% in three months
- Biggest drivers
- Housing +5.2% (electricity +12.8%) and transport +8.7% (fuel +23.6%)
- Brisbane
- 4.4%, a little above the eight-city average of 4.3%
- Jobs
- Unemployment 4.7% in September, with 39,300 fewer jobs in the month
- Cash rate
- 4.60% since 30 September 2026, the highest since 2011. Next decision: 3 November, 2:30 pm AEDT.
- My call
- Rise to 4.85% on 3 November (about 60%). Hold about 35%, a 0.5-point rise about 5%.
Useful already? ☕ Buy me a coffee and keep these explainers free and ad-free.覺得有用?☕ 請我喝杯咖啡,讓這些解說繼續免費、無廣告。
What did the September 2026 CPI show?
Prices rose 0.8% in the month of September, after 1.0% in July and 0.4% in August. That makes the September quarter +1.3%. For comparison, prices rising 2.5% a year, the middle of the RBA’s target, works out to about 0.6% a quarter. The quarterly trimmed mean was 1.0%, which is still about 4% a year.
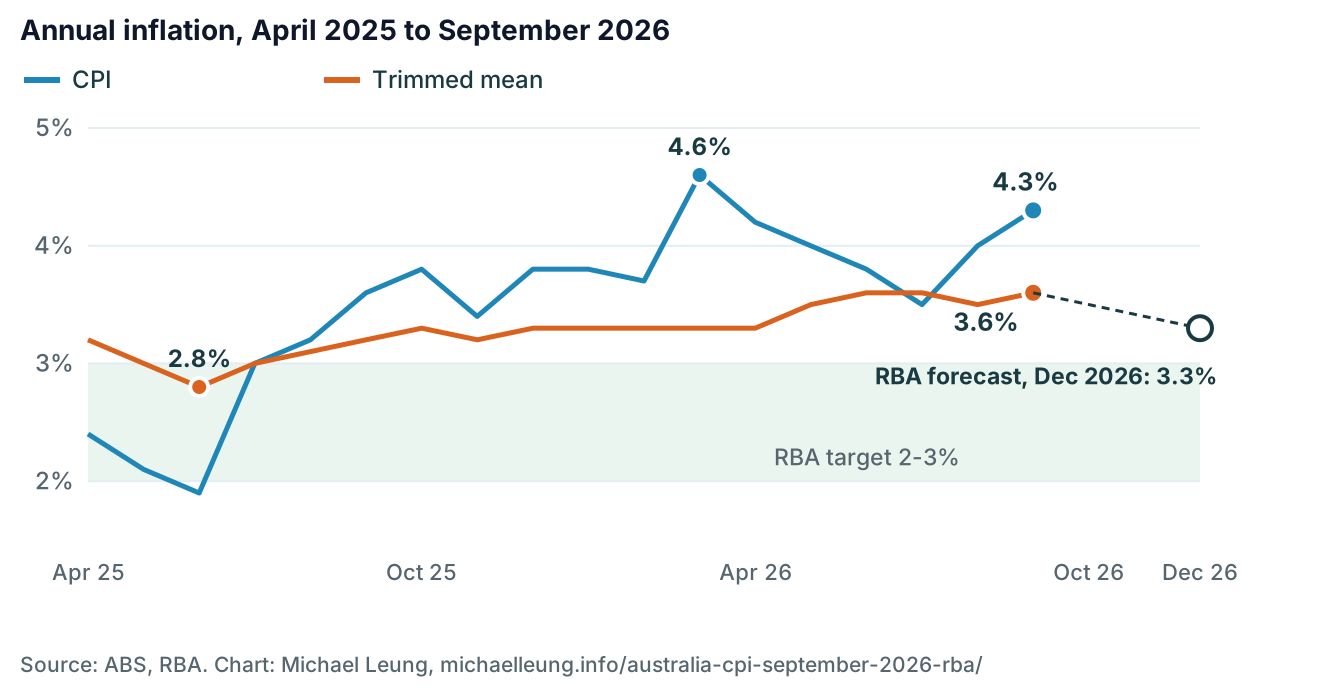
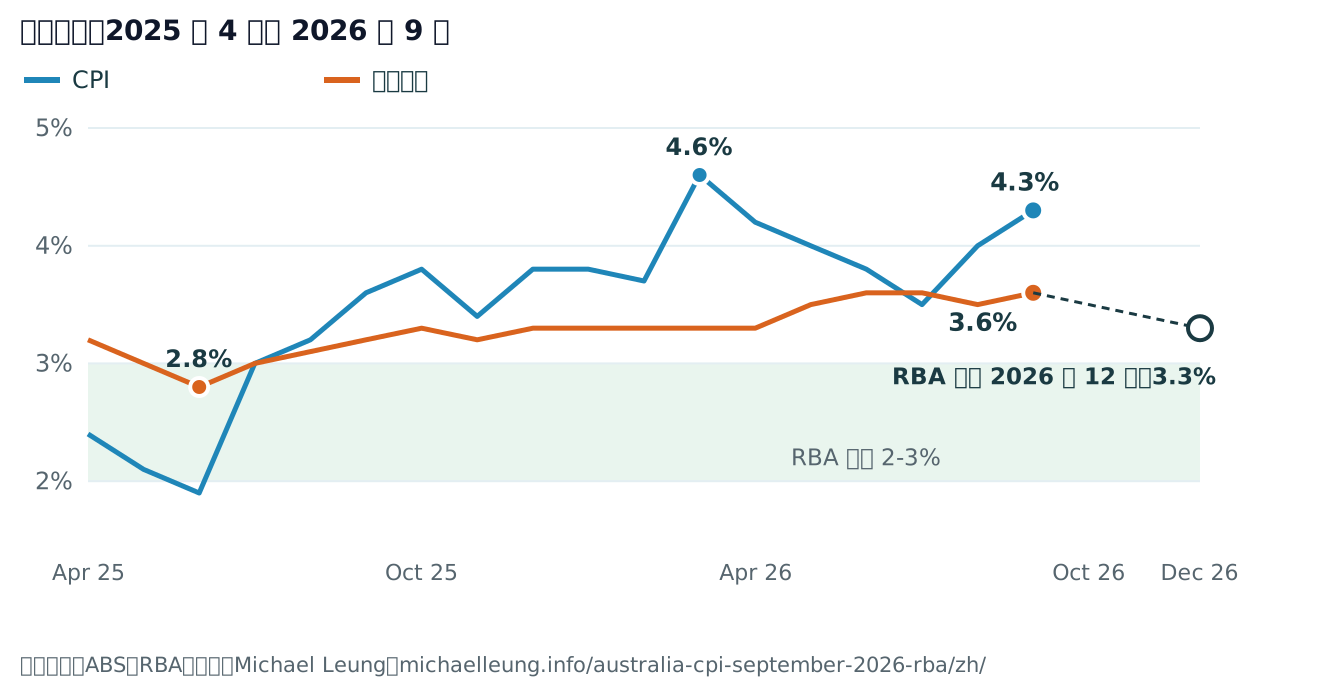
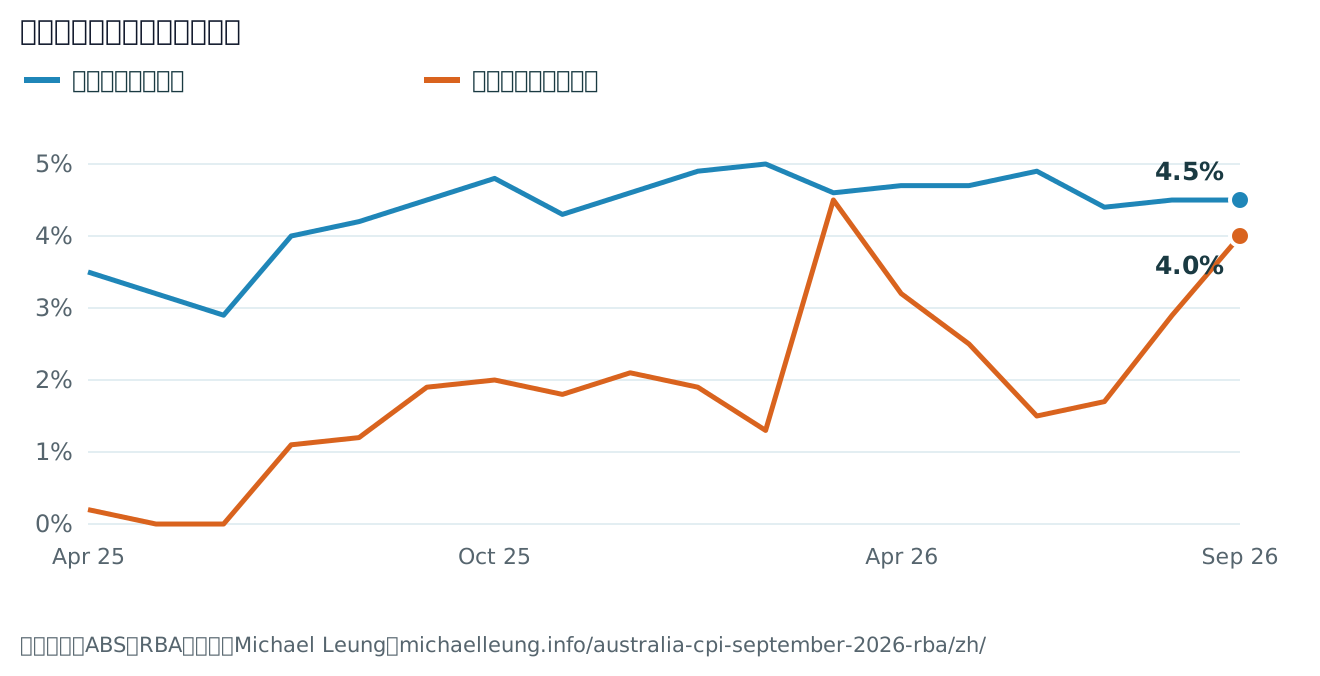
Annual inflation, all groups CPI and trimmed mean, monthly. The shaded band is the RBA’s 2–3% target; the ring is the RBA’s August forecast for the trimmed mean in December 2026. Sources: ABS Consumer Price Index, September 2026; RBA Statement on Monetary Policy, August 2026.
The trimmed mean has now been at 3.3% or higher for ten months in a row, from December 2025 to September 2026. Across the first nine months of 2026, headline inflation averaged about 4.0% and the trimmed mean 3.4%. In the last nine months of 2025 both averaged about 3.0%. This year is clearly worse.
What pushed Australian inflation up to 4.3%?
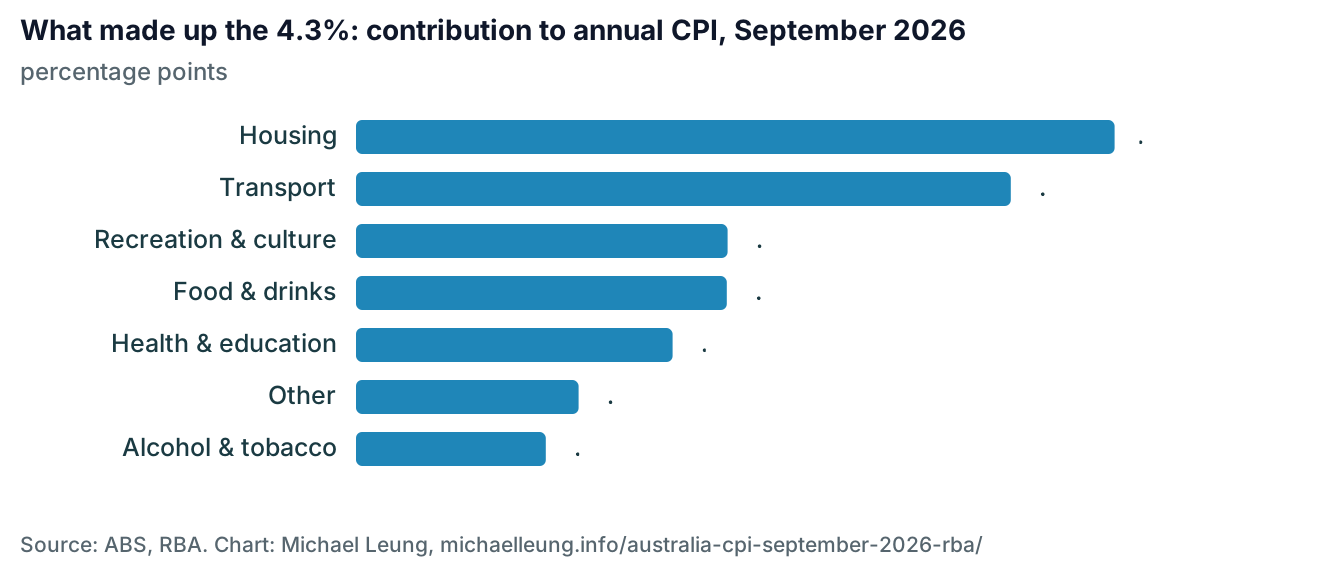
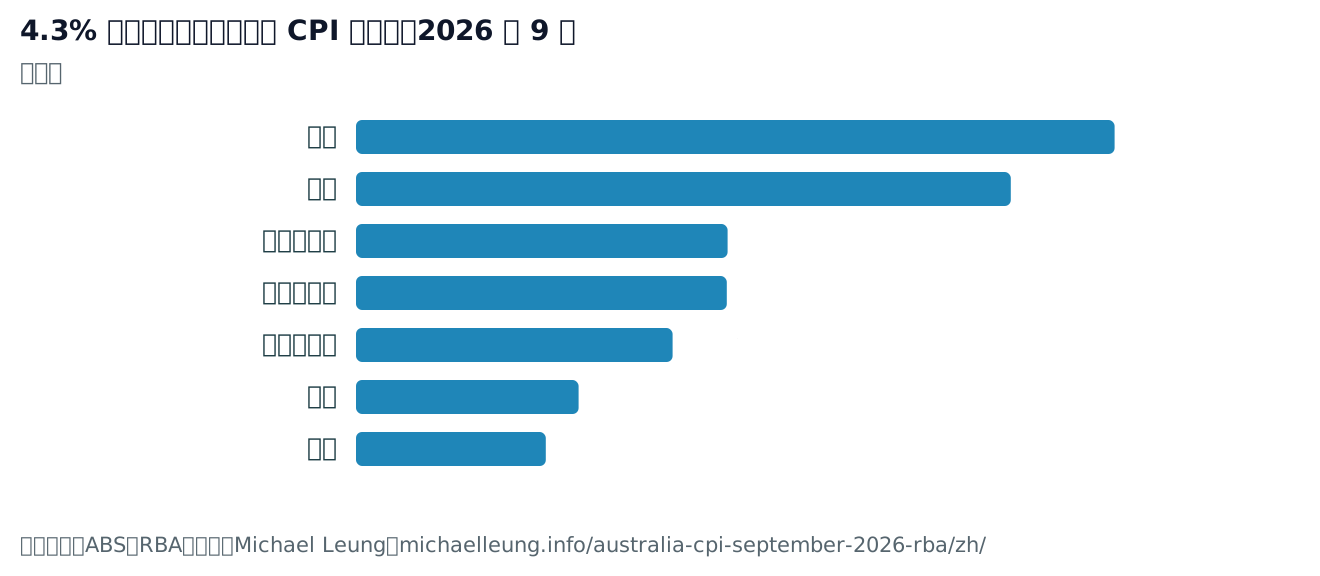
Contribution of each CPI group to annual inflation of 4.3% in September 2026, in percentage points. Health and education are combined, as the ABS does; ‘Other’ is clothing, furnishings, communication, insurance and financial services. Source: ABS Consumer Price Index, September 2026.
Housing added 1.14 percentage points to the 4.3% and transport added 0.99. Electricity is up 12.8% in a year, which the ABS says is largely because the Commonwealth energy rebates ended. Automotive fuel is up 23.6% in a year and rose 9.4% in September alone, after 14.8% in August, because of higher world oil prices.
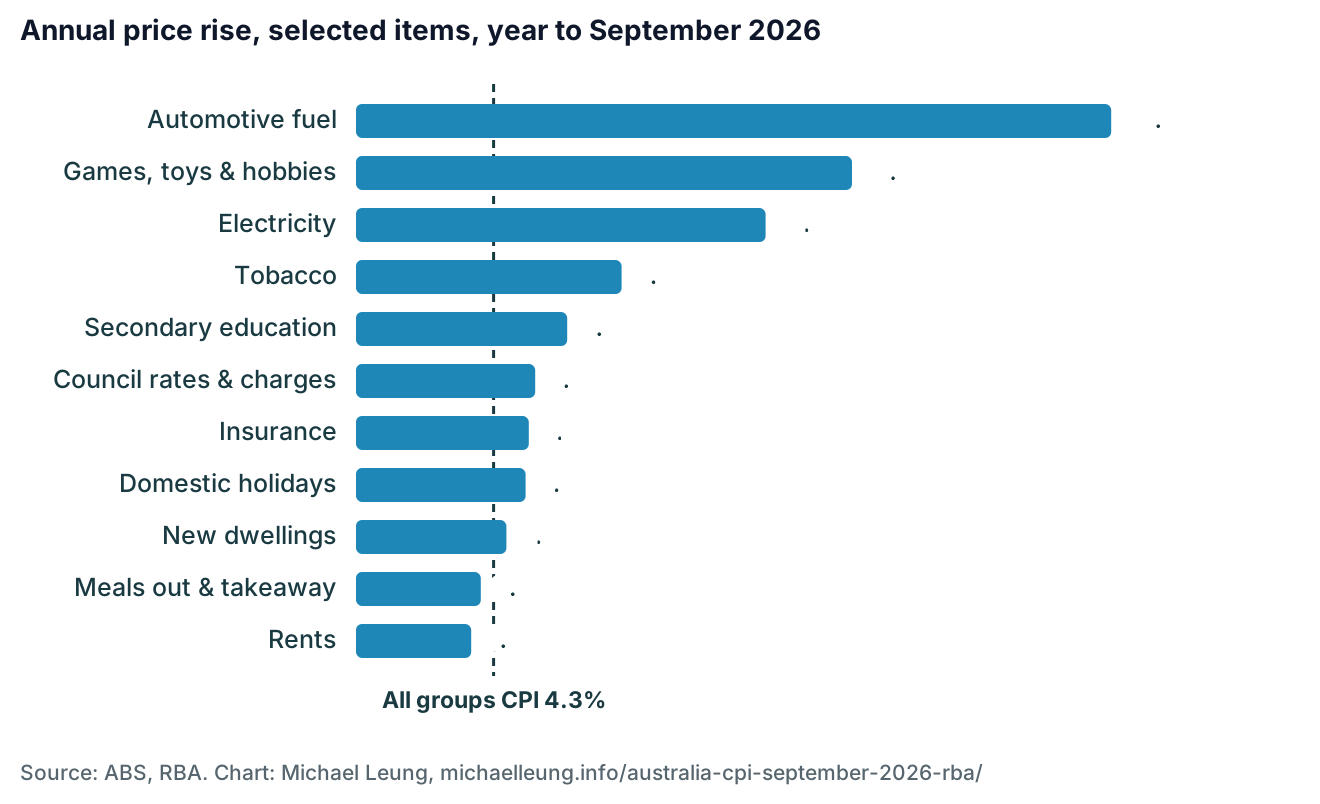
Some rises are less obvious. Games, toys and hobbies are up 15.5% because memory and storage chips cost more, a knock-on from the AI building boom. Domestic holidays jumped 8.0% in the month with the school holidays and big sporting events. Meals out and takeaway rose 3.9% on higher ingredient and running costs.
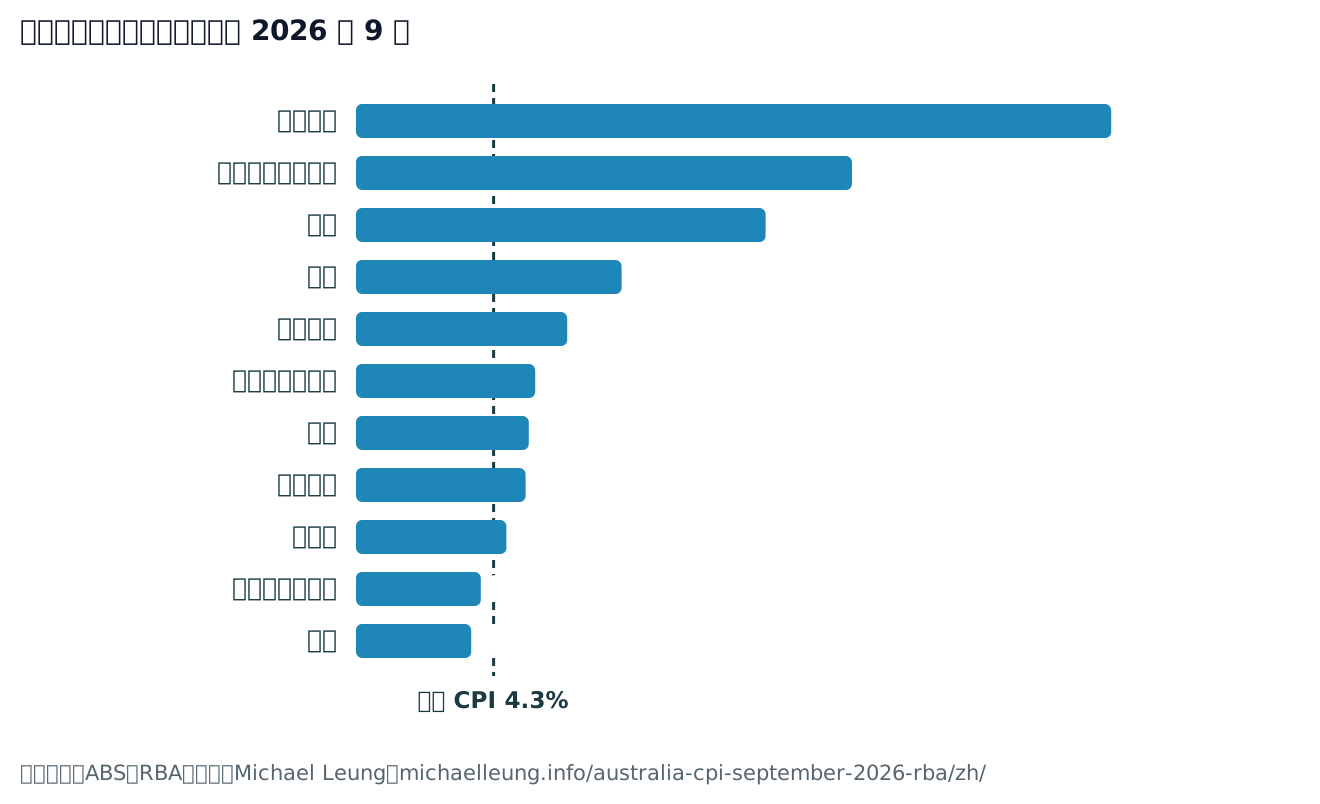
Annual price change for selected items, year to September 2026, against headline CPI of 4.3% (dashed line). Source: ABS Consumer Price Index, September 2026.

Illustration generated with Qwen Image 2.1
Is it just petrol and power bills?
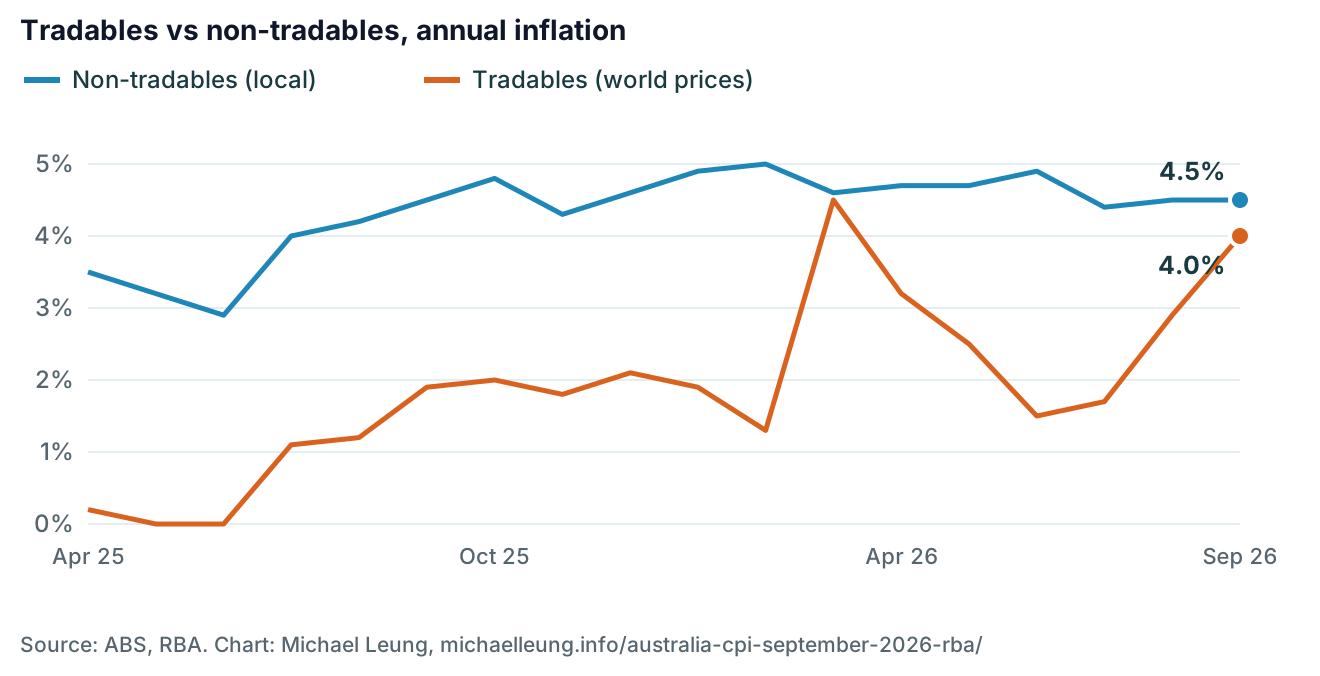
The ABS splits prices into tradables, things whose prices are set by world markets such as fuel and electronics, and non-tradables, mostly local services, rents and building costs. Tradables jumped from 2.9% to 4.0% in a month: that is the oil shock. Non-tradables held at 4.5%. Services overall sped up from 3.7% to 4.1%. Essentials (non-discretionary items) are up 5.2%.
Annual inflation for tradables (prices set by world markets) and non-tradables (mostly local services, rents and building costs), monthly. Source: ABS Consumer Price Index, September 2026.
To be fair, there is a softer side too. Fuel was removed from the trimmed mean this month, which is why it sits well below the headline. New home prices were flat in September (0.0%) and their annual rise slowed from 5.4% to 4.7% as builders offered more discounts. Clothing fell 2.7% in the month. Electricity’s jump is mostly a government rebate ending, not households spending more. Eight of the eleven CPI groups are rising faster than 3%, though, so this isn’t one or two items.
How fast are prices rising in Brisbane?
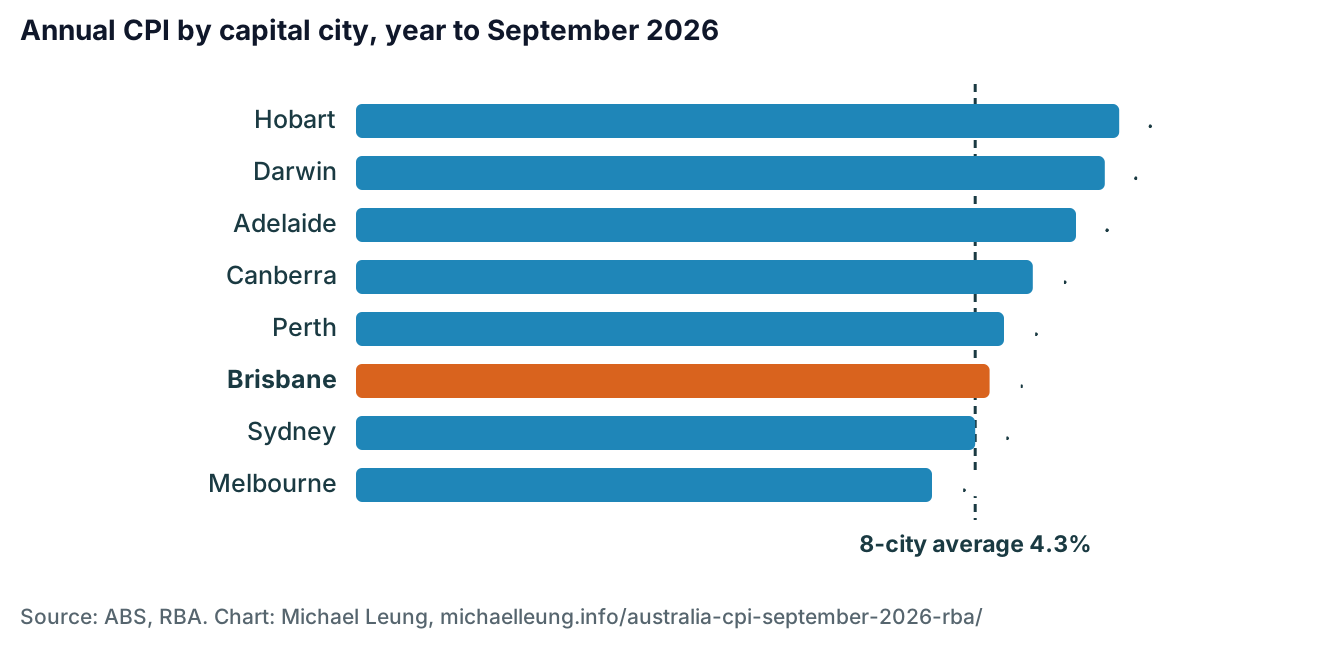
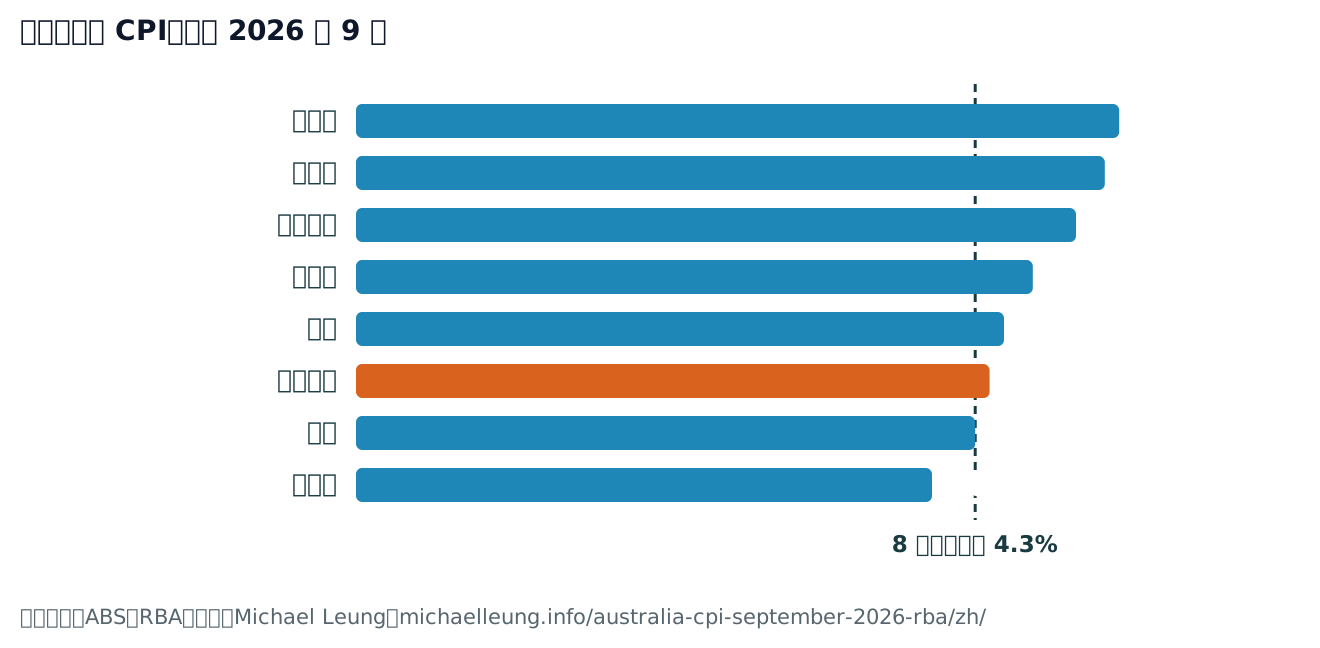
Annual CPI inflation by capital city, year to September 2026. Source: ABS Consumer Price Index, September 2026.
Hobart (5.3%), Darwin (5.2%) and Adelaide (5.0%) had the fastest rises; Melbourne (4.0%) the slowest. Living in Brisbane, the price rises I notice most are the same ones driving the national figure: the bowser and the power bill. The point for the RBA is that inflation is high everywhere, not in one city, so one interest rate fits the problem.
Doesn’t a weaker job market argue for waiting?
Unemployment was 4.7% in September (trend 4.6%), up from 4.1% in January, and employment fell 39,300 in the month. I covered the details in part 11. The ABS has also warned that changes to its survey make this month’s jobs data harder to read, and the RBA’s minutes urge “considerable caution” with them.
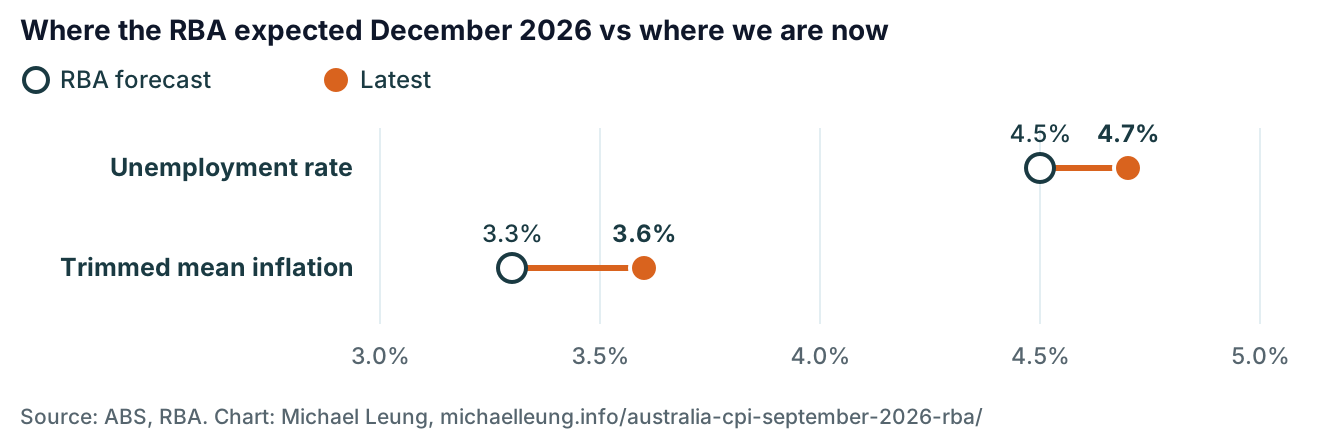
Latest outcome against the RBA’s August forecast for the December quarter 2026. Unemployment is higher than forecast, and so is underlying inflation. Sources: ABS; RBA Statement on Monetary Policy, August 2026.
The September minutes give the Board’s answer. Staff were “increasingly questioning whether the rate of unemployment that is consistent with the inflation target was higher than previously assessed”. In plain words, 4.7% unemployment may not be as much slack as it looks. The Board also said beating inflation now “would require accepting slower growth in demand and employment than would otherwise be the case”.

Illustration generated with Qwen Image 2.1
Will the RBA raise rates on 3 November 2026?
- This is the first full quarter since the last rise, and it was hot. On 29 September the Board only had data to August. Now it has a 1.3% quarter and a trimmed mean that went up, from a base that was revised down.
- The Board said it would act on this kind of news. Its September statement said “some of the upside risks flagged in August are materialising” and kept the option of “increasing the cash rate target further if needed”. The vote was unanimous.
- It has argued against waiting. The minutes say “waiting for further confirmation of the outlook for inflation could be costly, given that inflation had already been above target for an extended period”.
- The rise is broad, not just fuel. Non-tradables 4.5%, services 4.1%, eight of eleven groups above 3% and every capital city above 4%.
- Its forecast is drifting away. In August the RBA expected the trimmed mean to ease to 3.3% by December. It has gone the other way, to 3.6%.
RBA cash rate target since January 2025. The dashed step is my expected 0.25-point rise on 3 November, not an RBA forecast. Sources: RBA cash rate target; RBA Board meeting schedule.
Why did I change my mind since part 11?
The annual trimmed mean landed at 3.6%, not well above it, so on that test alone it is close. What tipped me is everything around it: a 1.3% quarter, services speeding up, a rise from a revised-down August, and fuel still climbing 9.4% in a month. Those are the “upside risks” the Board said it was watching. I would rather change my view than defend an old one against new data.
What could keep rates on hold?
- Much of the jump is one-offs. Fuel, the end of electricity rebates, tobacco indexation and yearly council rates are not what interest rates fix.
- Jobs are weakening faster than planned. Unemployment is 4.7% against a 4.5% forecast for December, and employment fell 39,300 in September.
- Households are already pulling back. The household saving ratio rose to 6.1% in 2025-26, consumption growth is below trend and house prices are falling in most capitals.
- The last rise is five weeks old. The Board could wait for wages (18 November), October jobs (19 November) and October CPI (25 November), then move on 8 December.
New RBA forecasts come out with the decision on 3 November. If staff still see inflation back in the band on roughly the same timetable, a hold becomes more likely. If they push the date out past late 2027, a rise becomes more likely.
What are the odds for 3 November?
| Outcome on 3 November | Why it could happen | My odds |
|---|---|---|
| Rise 0.25 to 4.85% | The Board treats the 1.3% quarter and 4.5% non-tradables as confirmation of broad price pressure | About 60% |
| Hold at 4.60% | It looks through fuel and rebates, and waits for November data before acting in December | About 35% |
| Rise 0.5 to 5.10% | Only if new forecasts show inflation staying well above target into 2028; every 2026 move has been 0.25 | About 5% |
After that: if the RBA rises on 3 November, I expect a pause at 4.85% in December while the effects build. If it holds, December becomes the likely date for the rise instead.
These odds are my own judgement from the published ABS and RBA data, not market pricing or RBA guidance.
Which dates should you watch?
- 3 November 2026, 2:30 pm AEDT: RBA decision and new forecasts in the Statement on Monetary Policy
- 18 November 2026: Wage Price Index, September quarter (ABS)
- 19 November 2026: October jobs figures (ABS)
- 25 November 2026: CPI for October (ABS)
- 8 December 2026: RBA decision
What would a 4.85% cash rate mean for my mortgage?
That is for a 30-year principal-and-interest loan at a rate between 6% and 7%. On a $600,000 loan it is roughly $97 to $101 a month. A 4.85% cash rate would be the highest since December 2008. My September rate rise explainer works through the costs in more detail, and wages vs inflation shows why pay has felt tight since 2019.
Show the monthly numbers behind the charts
| Month | CPI, monthly | CPI, annual | Trimmed mean, annual | Tradables | Non-tradables |
|---|---|---|---|---|---|
| Sep 26 | +0.8% | 4.3% | 3.6% | 4.0% | 4.5% |
| Aug 26 | +0.4% | 4.0% | 3.5% | 2.9% | 4.5% |
| Jul 26 | +1.0% | 3.5% | 3.6% | 1.7% | 4.4% |
| Jun 26 | -0.1% | 3.8% | 3.6% | 1.5% | 4.9% |
| May 26 | -0.7% | 4.0% | 3.5% | 2.5% | 4.7% |
| Apr 26 | +0.4% | 4.2% | 3.3% | 3.2% | 4.7% |
| Mar 26 | +1.1% | 4.6% | 3.3% | 4.5% | 4.6% |
| Feb 26 | +0.0% | 3.7% | 3.3% | 1.3% | 5.0% |
| Jan 26 | +0.4% | 3.8% | 3.3% | 1.9% | 4.9% |
| Dec 25 | +1.0% | 3.8% | 3.3% | 2.1% | 4.6% |
| Nov 25 | +0.0% | 3.4% | 3.2% | 1.8% | 4.3% |
| Oct 25 | +0.0% | 3.8% | 3.3% | 2.0% | 4.8% |
| Sep 25 | +0.5% | 3.6% | 3.2% | 1.9% | 4.5% |
| Aug 25 | -0.1% | 3.2% | 3.1% | 1.2% | 4.2% |
| Jul 25 | +1.3% | 3.0% | 3.0% | 1.1% | 4.0% |
| Jun 25 | +0.1% | 1.9% | 2.8% | 0.0% | 2.9% |
| May 25 | -0.5% | 2.1% | 3.0% | 0.0% | 3.2% |
| Apr 25 | +0.7% | 2.4% | 3.2% | 0.2% | 3.5% |
Source: ABS Consumer Price Index, Australia, September 2026 (released 28 October 2026). August’s trimmed mean was revised from 3.6% to 3.5%.
Download the charts
Every chart on this page is a free SVG file you can open, print or reuse with a link back to this page.
- Annual CPI and trimmed mean, April 2025 to September 2026
- What added to the 4.3%: contribution by CPI group
- Biggest price rises: selected items
- Tradables vs non-tradables inflation
- Inflation by capital city, with Brisbane highlighted
- RBA cash rate and the 3 November decision
- RBA forecast vs latest: unemployment and trimmed mean
Common questions
What is Australia’s inflation rate in September 2026?
Annual CPI inflation was 4.3% in the year to September 2026, up from 4.0% in August. Trimmed mean inflation was 3.6%. Prices rose 1.3% in the September quarter (ABS, released 28 October 2026).
Will the RBA raise interest rates on 3 November 2026?
My view is yes, a 0.25-point rise to 4.85%, at about 60% likelihood. The September quarter CPI was stronger than the RBA expected and the Board has said it will raise rates further if needed. A hold is the main alternative, at about 35%.
Why did inflation rise in September 2026?
Mainly housing (up 5.2%, with electricity up 12.8% as Commonwealth rebates ended) and transport (up 8.7%, with fuel up 23.6% on higher world oil prices). Services inflation also rose, from 3.7% to 4.1%.
What is the inflation rate in Brisbane?
Brisbane’s CPI rose 4.4% in the year to September 2026, slightly above the eight-capital average of 4.3%. Hobart was highest at 5.3% and Melbourne lowest at 4.0%.
What is the trimmed mean and why does the RBA use it?
The trimmed mean drops the items with the biggest price rises and falls each period and averages the rest, so one-off shocks such as a fuel spike do not distort it. In September 2026 automotive fuel was trimmed out, which is why the trimmed mean (3.6%) sits well below headline CPI (4.3%).
When is the next RBA meeting?
The Monetary Policy Board meets on 2–3 November 2026 and announces its decision at 2:30 pm AEDT on 3 November, with new forecasts. The meeting after that is 7–8 December 2026.
Sources
- ABS · Consumer Price Index, Australia, September 2026
- ABS · CPI rose 4.3% in the year to September 2026
- ABS · Labour Force, Australia, September 2026
- ABS · Australian System of National Accounts, 2025-26
- RBA · Cash Rate Target
- RBA · Statement by the Monetary Policy Board
- RBA · Minutes of the Monetary Policy Board Meeting, 28–29 September 2026
- RBA · Statement on Monetary Policy, August 2026: Outlook
- RBA · Board Meeting Schedules
General information only, not financial advice. Research was AI-assisted; every figure was checked against ABS and RBA publications on 28 October 2026. The odds and views on future rates are my own.
Found this useful?
Buy me a coffee ☕
Everything here is free and ad-free. A coffee or a AU$1/month membership keeps new articles, games and tools coming.
Also in the shop:VoidFill · The Architect’s Monologue · Brisbane photo prints
Series: Australian Economy 2026 (part 12 of 12)系列:2026 澳洲經濟(第 12 / 12 篇)
Rates, wages, housing and prices: what the 2026 numbers mean for Australian households.利率、工資、樓價與物價:2026 年的數字對澳洲家庭意味著甚麼。
- Will the RBA Raise Rates? Australia's Jobs and Inflation儲備銀行會加息嗎?澳洲就業與通脹
- RBA Raises the Cash Rate to 4.60%儲備銀行加息至 4.60%
- Wages vs Inflation 2019–2026: CPI +26.8%, WPI +20.8%工資對通脹 2019–2026
- Negative Gearing & CGT Reform: House Prices in Every Capital負扣稅與資本增值稅改革:各首府房價
- Card Surcharge Ban: Who Really Pays Now?禁止刷卡附加費:誰在埋單?
- University vs TAFE: Who Goes Where After Year 12?大學定 TAFE?中學畢業生去向
- Trade Surplus Falls to $495m: Computers, Fuel and Iron Ore貿易順差跌至4.95億:電腦、燃油與鐵礦石
- Bracket Creep: Median Tax Rate 21.6%→25.5%稅級攀升:中位數稅率 21.6%→25.5%
- Medicare Explained: Cover, Costs and LevyMedicare 全解:保障、費用與徵費
- Building Approvals August 2026: Is Australia Building Enough?2026年8月建築審批:澳洲建屋夠快嗎?
- Jobs Fall 39,300: RBA to Hold, Then Hike?就業減少39,300:儲備銀行先按兵不動,再加息?
- CPI Hits 4.3%: Will the RBA Hike on 3 November?通脹升至4.3%:儲備銀行11月3日會加息嗎?