Australia approved 16,953 new homes in August 2026, down 6.1% on July. The fall came from apartments and townhouses, which dropped 21.2%. House approvals rose 3.7% to 10,885, the most in any month since August 2021. Over the 12 months to August, 208,181 homes were approved, 9.1% more than a year earlier. The building figures released a week later show the other side. More homes are being started and finished, and a record number are under construction. But completions are still well short of the Housing Accord pace: 355,817 homes were finished in the Accord's first two years, against the 480,000 an even pace would need. That leaves the country 124,183 homes behind.
Below I go through both ABS releases: what was approved in August, what was actually started and finished in the June quarter, how Queensland compares, and what it means for the 1.2 million homes target. All figures are seasonally adjusted unless I say otherwise.
What Happened to Building Approvals in August 2026?
Total approvals fell 6.1%, but only because apartment approvals fell sharply. House approvals kept rising.
| August 2026 | Approved | Change on July | Change on Aug 2025 | Trend |
|---|---|---|---|---|
| Total dwellings | 16,953 | −6.1% | +10.3% | 18,202 (−0.8%) |
| Private houses | 10,885 | +3.7% | +18.4% | 10,749 (+0.5%) |
| Private apartments & townhouses | 5,674 | −21.2% | −2.1% | 7,105 (−2.6%) |
Houses and apartments are private sector only, so they add up to a little less than the total, which also includes public housing.
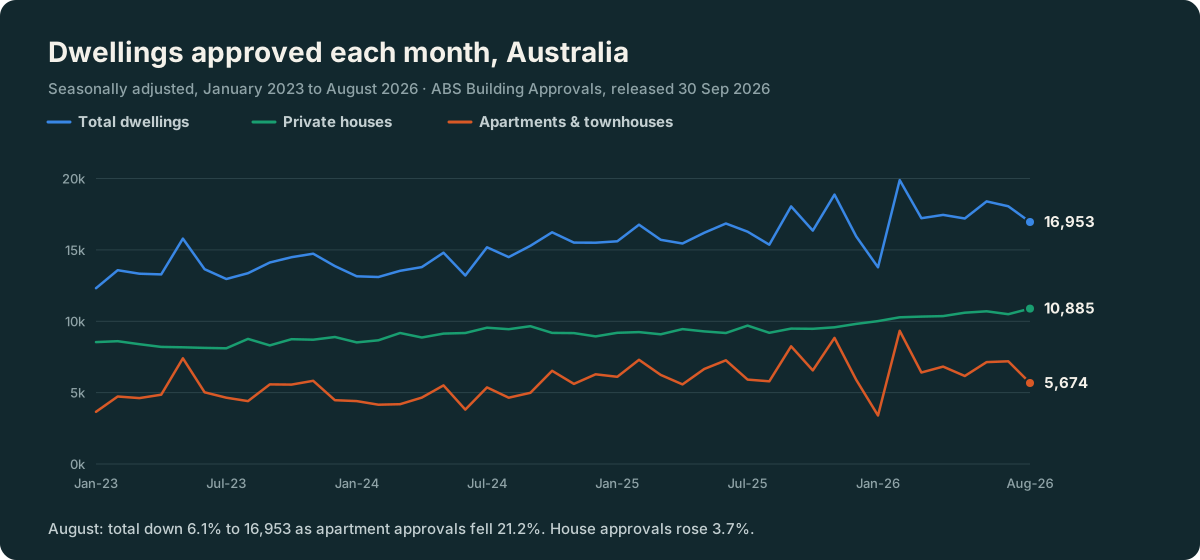
The chart shows why I would not read too much into one month. Apartment approvals jump around because a single tower can add several hundred homes in one month. In January 2026 they fell to 3,401 and then bounced to 9,334 in February. The trend series, which smooths this out, fell only 0.8% in August. The steadier story is houses: they have climbed slowly for two years and are now at a five-year high.
The value of non-residential building approved also fell 44.8% to $5.53 billion, after a 15.7% rise in July. That series is just as lumpy, because one hospital or warehouse can move it.
Are More Homes Being Built?
Yes. In the June quarter, 52,201 homes were started and 47,168 were finished, and both are well up on a year earlier.
- Started (commencements): 52,201, up 7.0% on the March quarter and 14.4% on a year earlier. New houses rose 11.6% to 31,707.
- Finished (completions): 47,168, up 5.8% on the quarter and 15.9% on a year earlier. Apartment and townhouse completions jumped 58.6% over the year to 19,018.
- Under construction: 248,733 homes at the end of June (original terms), up from 244,132 in March. That is the highest in the ABS series published with this release, which goes back to 2018, and press reports call it a record.
- Value of building work done: $45.8 billion in the quarter, up 1.1%.
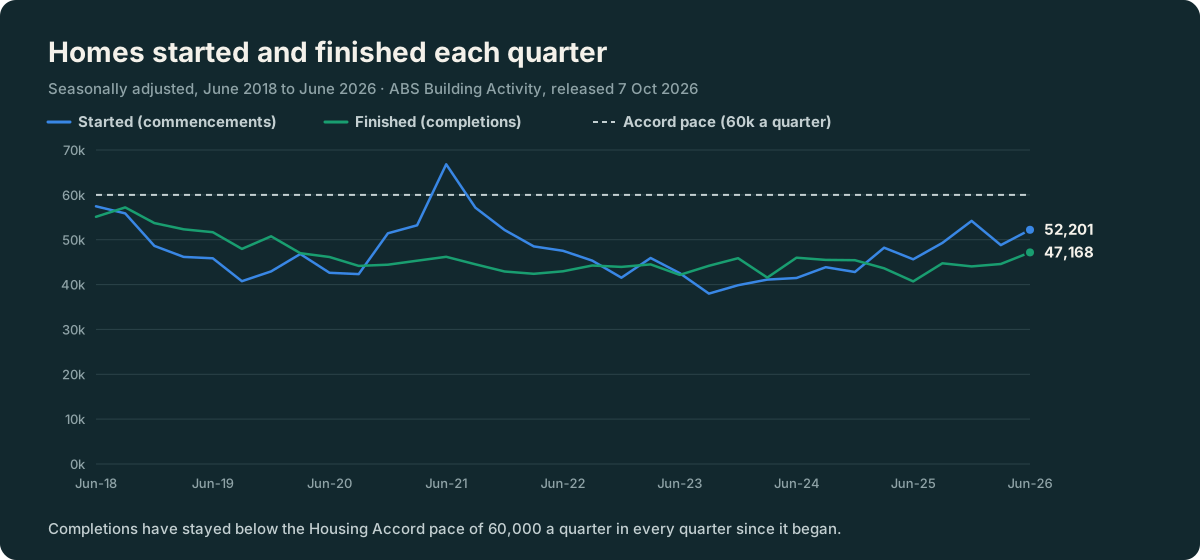
Over the four quarters to June 2026, about 204,500 homes were started and 180,500 were finished. More homes are being started than finished, which is why the pile under construction keeps growing. That is good news for future supply, but those homes still have to be completed. The ABS also warns that this release is based on a response rate of about 85%, lower than usual, so the June figures may be revised in January.
What About Queensland?
Queensland had the biggest fall in August, but most of it was apartments. House approvals in Queensland rose.
| State | Total approved, Aug | Change on July | Private houses, Aug | Change on July |
|---|---|---|---|---|
| NSW | 3,896 | −17.3% | 2,167 | −4.5% |
| Victoria | 5,163 | +8.9% | 3,044 | +0.5% |
| Queensland | 3,327 | −22.5% | 2,456 | +6.5% |
| South Australia | 1,701 | +24.0% | 1,036 | +27.7% |
| Western Australia | 2,395 | +3.2% | 1,895 | +8.6% |
| Tasmania | 264 | −1.5% | n/a | n/a |
Seasonally adjusted. The ABS does not publish seasonally adjusted totals for the NT and ACT, or seasonally adjusted house figures for Tasmania.
Queensland's trend figure tells a calmer story: 4,462 approvals, up 1.0% on July. And Queensland builders were busier in the June quarter. They started 11,671 homes, up from 11,342 in March, and finished 9,549, up from 8,967. As someone who lives in Brisbane, I watch the new estates on the city's edges fill up quickly, so it is good to see Queensland house approvals going the right way.
Is Australia on Track for 1.2 Million Homes?
No. After two of the five years, Australia is about 124,000 homes behind an even pace.
The National Housing Accord aims for 1.2 million new homes in the five years from 1 July 2024 to 30 June 2029. That is 240,000 a year, or 60,000 a quarter. Adding up the ABS completions for the eight quarters from September 2024 to June 2026 gives 355,817 homes. An even pace would have needed 480,000 by now.
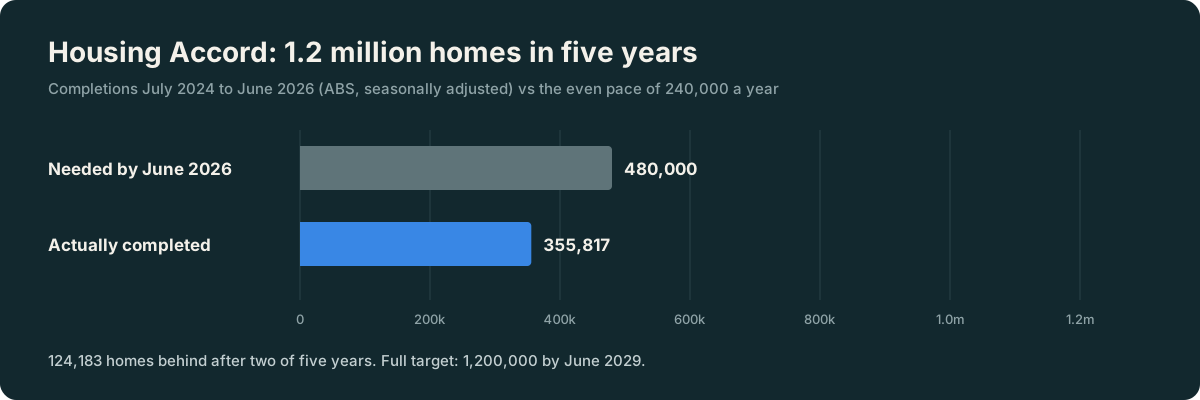
To catch up, the country would need about 281,000 completions a year for the next three years. That is about 70,000 a quarter, roughly 50% more than the 47,168 finished in the June quarter. Australia has never completed homes at that rate in the data shown here. The highest quarter since 2018 was 57,205, in September 2018.
The National Housing Supply and Affordability Council now expects the 1.2 million mark to be reached in the December quarter of 2030, about 18 months after the Accord ends. The record number of homes under construction is the main reason for some optimism. If most of those 248,733 homes are finished over the next two years, completions should keep rising.
What Does This Mean for Buyers and Renters?
More supply is coming, but slowly. It will not change prices or rents quickly.
Approvals lead commencements by a few months, and commencements lead completions by a year or more for houses, longer for apartments. So the rise in house approvals this year will mostly show up as finished homes in 2027 and later. In the meantime, the Reserve Bank has lifted the cash rate four times this year, to 4.60% in September. Higher rates make building more expensive to finance and reduce how much buyers can borrow, which works against the push for more supply.
My own take: the house numbers are better than the headline suggests, and the pipeline is the strongest it has been in years. But the gap to the Accord target is now so large that it is very unlikely to be closed by 2029. For people waiting to buy or rent, the practical message is that relief from new supply is a slow, multi-year story, not something the next few months will fix. If you want to see how policy changes could affect prices instead, see my look at negative gearing, CGT reform and house prices in each capital.
Related reading: RBA raises the cash rate to 4.60% · Wages vs inflation in Australia, 2019–2026 · Negative gearing & CGT reform: house prices in every capital
Sources
- Australian Bureau of Statistics, Building Approvals, Australia, August 2026 (released 30 September 2026; small-area data added 7 October 2026): national, state and value figures, and the monthly series from January 2023 used in the chart.
- Australian Bureau of Statistics, Building Activity, Australia, June 2026 (released 7 October 2026): commencements, completions, homes under construction, value of work done and the quarterly series used in the charts.
- National Housing Supply and Affordability Council, Quarterly Report, August 2026: the estimate that the 1.2 million target will be reached in the December quarter 2030.
Figures checked on 13 October 2026. The 12-month approval total, the four-quarter totals, the Accord progress figure (355,817) and the catch-up rate are my own sums of the ABS seasonally adjusted series, so they can differ slightly from original-terms totals. The Council's August report counted 308,000 completions to March 2026; adding the June quarter gives the same total as mine. The June quarter building activity figures are preliminary and will be revised on 13 January 2027. This is general information, not financial advice. This article was researched and drafted with AI assistance and reviewed by me. The images were made locally with Qwen Image 2.1 on an 8 GB RTX 4060 Ti, and the charts were drawn from the ABS data.