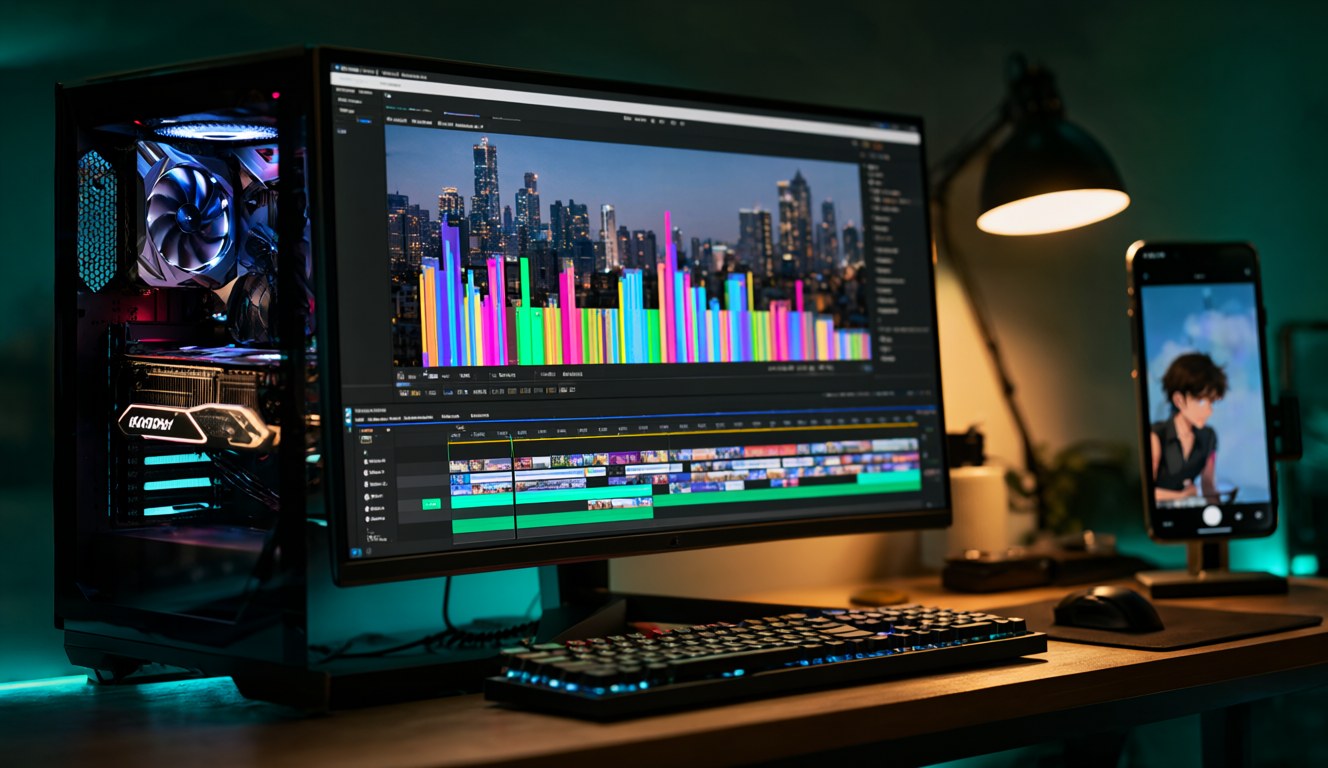
I now make short data videos on my own PC in minutes, not hours. Qwen Image 2.1 draws the background pictures, the Motion Graphics feature I used with Claude Opus 5.5 turns the figures into animated code, and ffmpeg joins the frames into an MP4. On my RTX 4060 Ti 8GB, each background took about 32 seconds, and rendering 12 seconds of 1080×1920 video took 22 seconds. One LTX video clip used to take me 4 to 5 minutes.
Below I show each step with screenshots from my machine, the code that makes the numbers move, and an animated preview of the result. At the end is the YouTube Short I made this way from the latest ABS building figures.
What Is Motion Graphics, and Why Is It Different from LTX?
Motion Graphics is animation written as code. It is like an animated <div> on a web page, not a video model guessing every pixel.
An image-to-video model such as LTX has to invent every frame on the GPU. That is great for moving people, water or cameras, but it is slow on an 8GB card. It also can't be trusted with numbers: a figure like 248,733 may come out blurred or wrong.
Motion Graphics works the other way round. The picture stays a still image from Qwen Image 2.1. Claude writes HTML, CSS and JavaScript that puts text, counters and bars on top and moves them over time. The browser draws each frame, so every number is sharp and exactly right. If a number is wrong, I change one line and render again.
Step 1: How Do I Make the Background Images in Qwen Image 2.1?
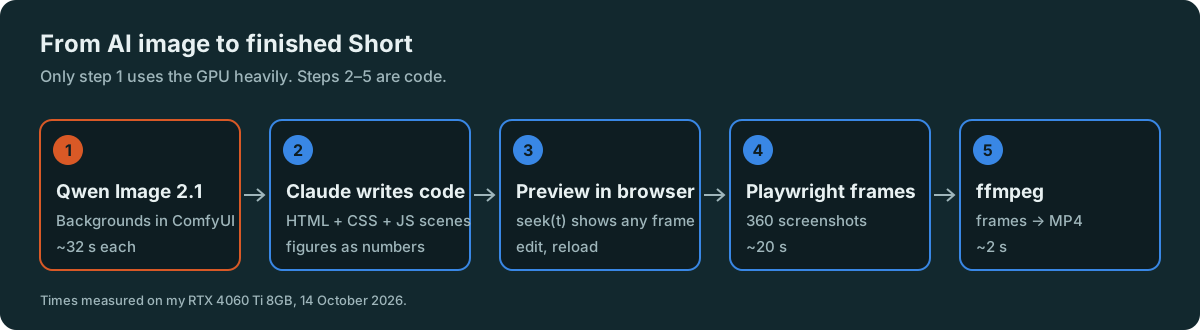
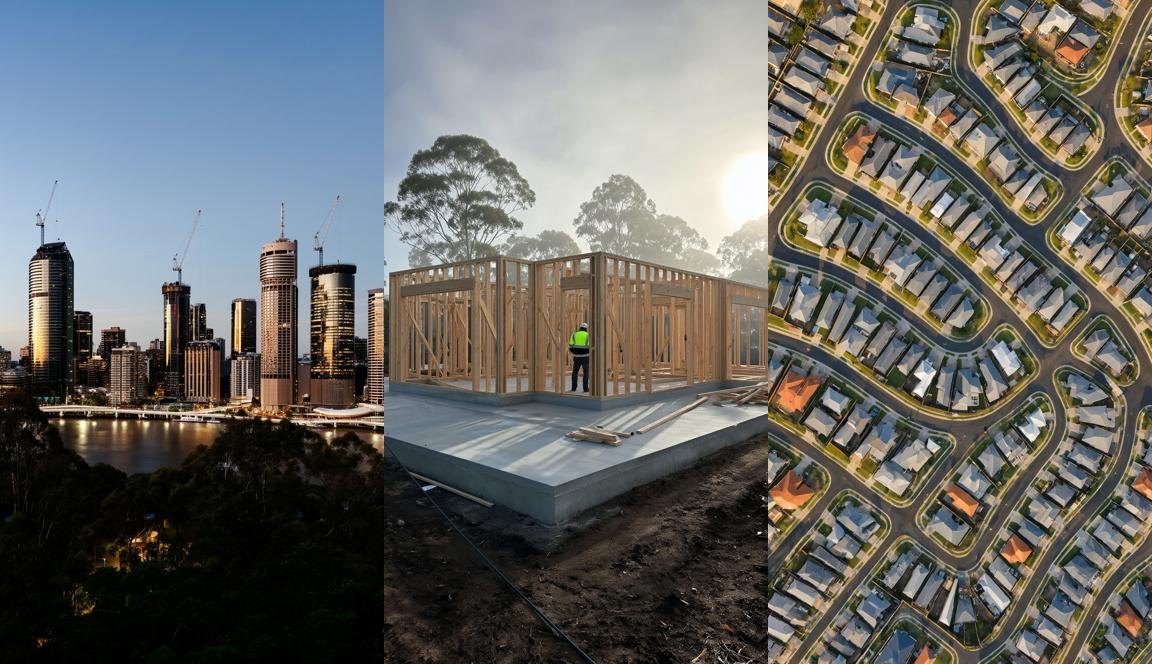
I use ComfyUI with the standard Qwen Image 2.1 graph, set to a vertical size of 768×1328 for a YouTube Short. Each image took 32 to 34 seconds on my 8GB card.
The graph has only ten nodes. It uses the int8 Qwen Image 2.1 model, the Qwen3-VL 8B text encoder, ModelSamplingAuraFlow with shift 3.1, and a KSampler at 20 steps, CFG 2.5, with the res_multistep sampler. My full setup is in Running Qwen-Image-2.1 on an 8GB GPU.
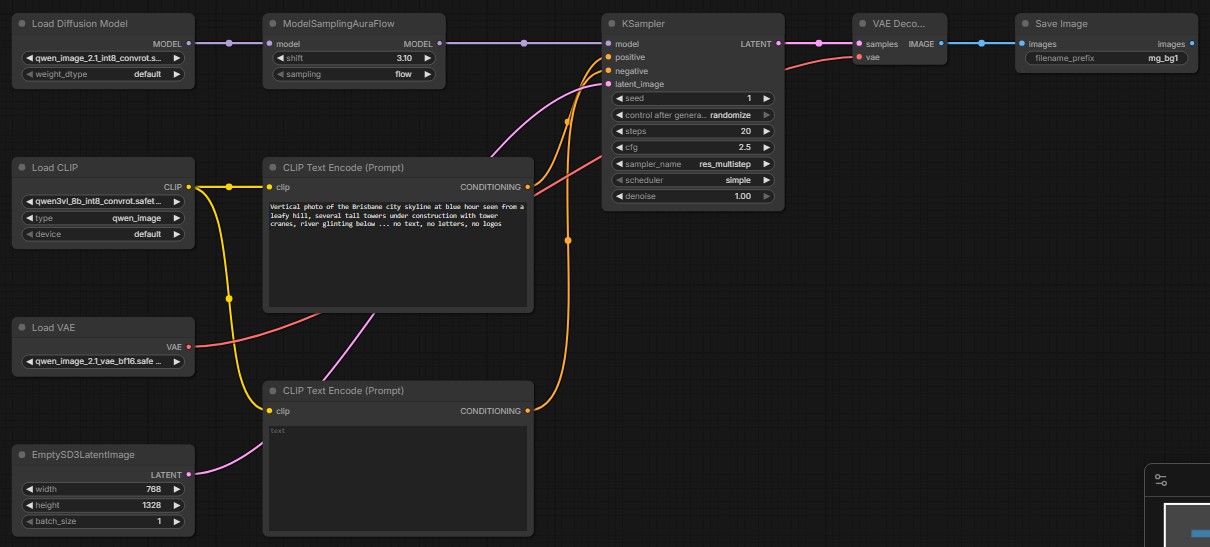
Two tips for video backgrounds:
- Ask for "no text, no letters, no logos". The numbers come from the code, so the picture must not have its own fake writing.
- Leave room for captions. I add "room for captions in the lower half" to the prompt, and the code puts a dark fade there so white text is easy to read.
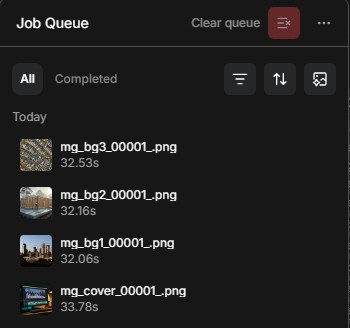
The ComfyUI job queue shows the real times. The three backgrounds and the cover for this article took 2 minutes 11 seconds in total:
Step 2: How Does the Code Make the Figures Move?
Every frame is a function of time. One JavaScript function, seek(t), sets the whole picture for any moment t in seconds.
For each scene, it works out how far into the scene we are. Then it:
- fades the scene in and out;
- zooms the Qwen image slowly (a "Ken Burns" move);
- slides the headline up;
- counts the figure up from 0 to its real value;
- fills a progress bar.
Because nothing depends on a real clock, frame 150 always looks exactly the same. That makes the render repeatable.
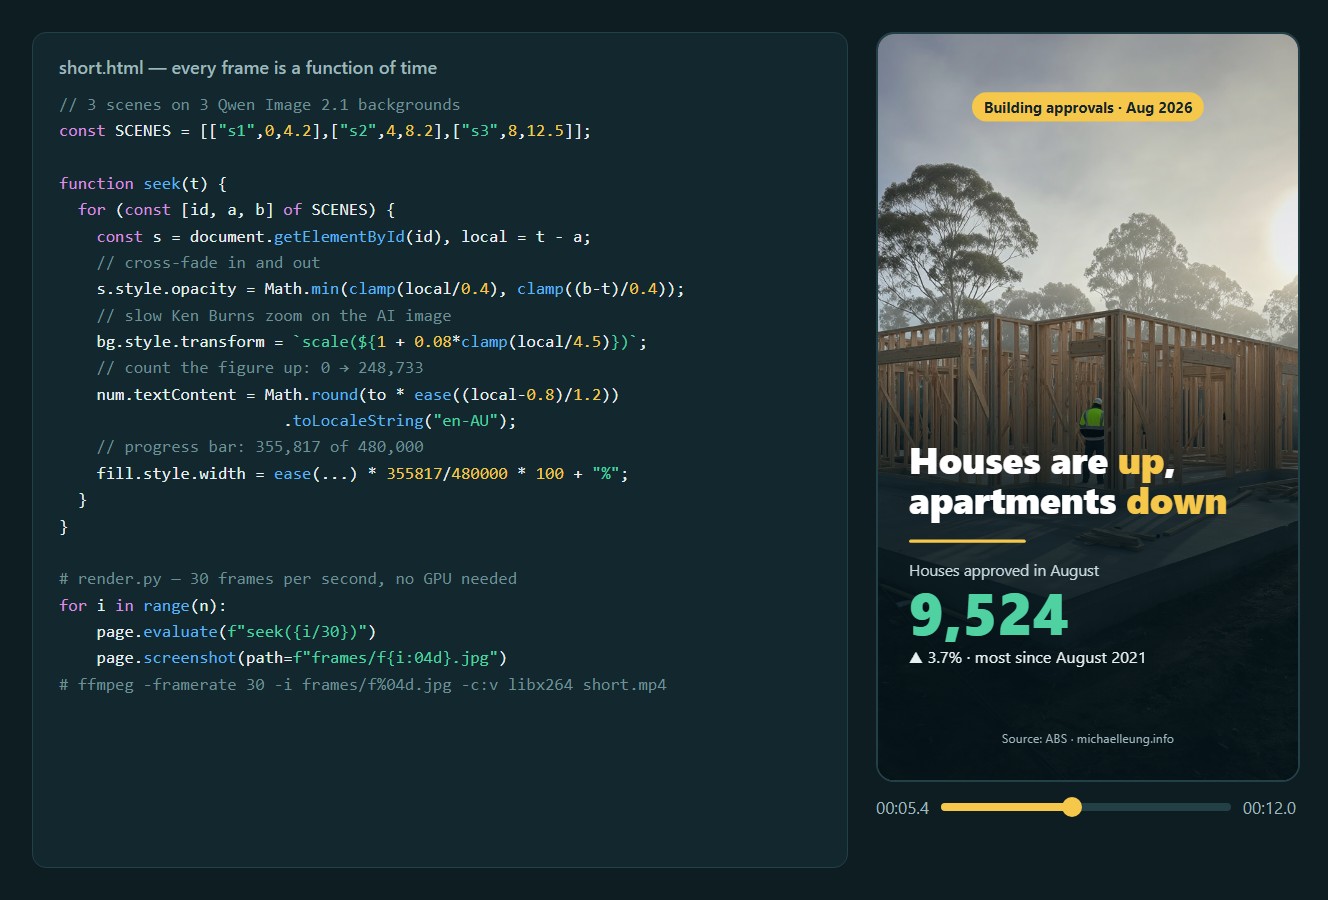
The code also lets me check the video before rendering it. I open the HTML file in Chrome, call seek(5.4), and look at that frame. If the headline wraps badly or a label overlaps, I fix the CSS and reload.
That is how I found two problems in my first render: a label covering the headline in the third scene, and the yellow tags wrapping onto two lines. Both took one line each to fix.
Step 3: How Do the Frames Become a Video?
A short Python script opens the page in headless Chrome through Playwright. For each frame it calls seek(i / 30) and saves a screenshot. ffmpeg then joins the screenshots into an H.264 MP4.
for i in range(n):                      # n = 12 s × 30 fps = 360
    page.evaluate(f"seek({i / 30})")
    page.screenshot(path=f"frames/f{i:04d}.jpg", type="jpeg", quality=92)

ffmpeg -framerate 30 -i frames/f%04d.jpg -c:v libx264 -crf 20 \
       -pix_fmt yuv420p -movflags +faststart short.mp4
On my PC the 360 frames took 19.5 seconds to capture and 2 seconds to encode. The GPU averaged about 16% while it ran, because Chrome only uses it to draw the page. No AI model runs during this step.
Here is the result, shown as an animated image at a smaller size:

The figures come from my article on Building Approvals in August 2026, so every number on screen matches the ABS data I checked there.
Is It Really Faster Than LTX on an 8GB GPU?
Yes, for this kind of video. The animation step is about ten times faster than one LTX clip, and it barely uses the GPU.
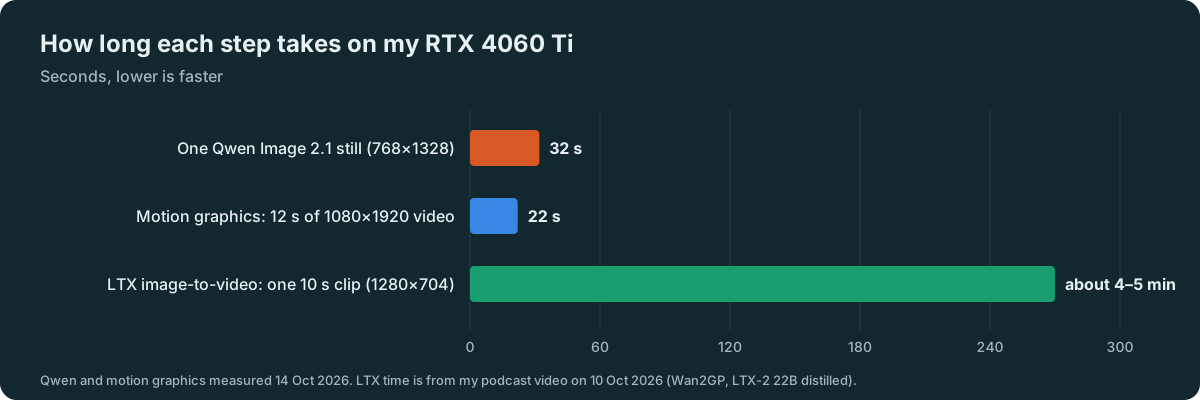
For my podcast video on 10 October, LTX-2 in Wan2GP took about 4 to 5 minutes for each 10-second clip at 1280×704. I also had to render clips one at a time to keep RAM free. A 1-minute video with six clips meant half an hour of rendering before any editing.
With Motion Graphics, a 12-second Short needs three Qwen images (about 1 minute 40 seconds) plus a 22-second render. The machine time is about 2 minutes.
The trade-off is the kind of movement you get:
- Use Motion Graphics for numbers, charts, titles, lists and slow zooms over a still picture. These suit news, finance and explainer Shorts.
- Use LTX when something in the picture must really move, such as a person walking, waves or a drone flight. Code can only move the whole image, not things inside it.
You can mix them, too. Use one LTX clip for the opening shot and Motion Graphics for the data scenes, then join them with ffmpeg.
What Do You Need to Try This at Home?
- A GPU for the images only. An 8GB card like the RTX 4060 Ti runs Qwen Image 2.1 in ComfyUI. If you have no GPU, you can use photos you took yourself.
- Python with Playwright (
pip install playwright, thenplaywright install chromium) to capture frames. - ffmpeg to join the frames into an MP4 and add music or a voice-over.
- An AI coding assistant to write the scene code. I described the scenes and the numbers, and Claude wrote the HTML. Then I asked for changes, such as a later start for the count-up or a different colour.
Check every number on screen against your source before you publish. The code shows exactly what you give it, mistakes included. For more on what runs well on this card, see my local LLM vs cloud API guide.
Watch the Short I Made This Way
This is the YouTube Short I made with Qwen Image 2.1 backgrounds and Motion Graphics, in Cantonese, from the ABS building figures: 澳洲起樓加緊油?昆士蘭動工一年多兩成|ABS建築數據 (YouTube).
Sources and Notes
- All times were measured on my own PC (RTX 4060 Ti 8GB) on 14 October 2026: ComfyUI 0.39, Qwen Image 2.1 int8, Playwright with Chromium, and ffmpeg 8.1. The LTX time comes from my podcast video on 10 October 2026.
- Figures in the demo video: Australian Bureau of Statistics, Building Approvals, Australia, August 2026 and Building Activity, Australia, June 2026. The Housing Accord figure is my own sum, explained in the building approvals article.
Checked on 14 October 2026. The demo video in this article is an English rebuild of the same method, made for this post. This article was drafted with AI assistance and reviewed by me. The images were made locally with Qwen Image 2.1, and the screenshots are from my own machine.