
Unemployment Hit 4.9% in October. Is Australia’s Job Market Cracking?

Illustration generated with Qwen Image 2.1
Australia’s unemployment rate rose to 4.9% in October 2026, the highest since October 2021. Employment fell by 43,500, almost all of it part-time, and youth unemployment reached 11.3%. My short answer: the job market is cooling faster than the RBA expected, but it is not cracking. The trend series, which smooths out the monthly noise, is at 4.8%, and trend employment was flat, not falling.
Below I go through the numbers that matter: the two-year trend, the monthly job swings, why part-time work took the hit, young people, the states and Queensland, and what it all means for the RBA’s decision on 8 December. It follows part 11 on the September jobs figures and part 13 on the November rate rise.
The October 2026 jobs figures in short
- Unemployment
- 4.9%, up 0.1 points; trend 4.8%. A year ago it was 4.3%.
- Jobs
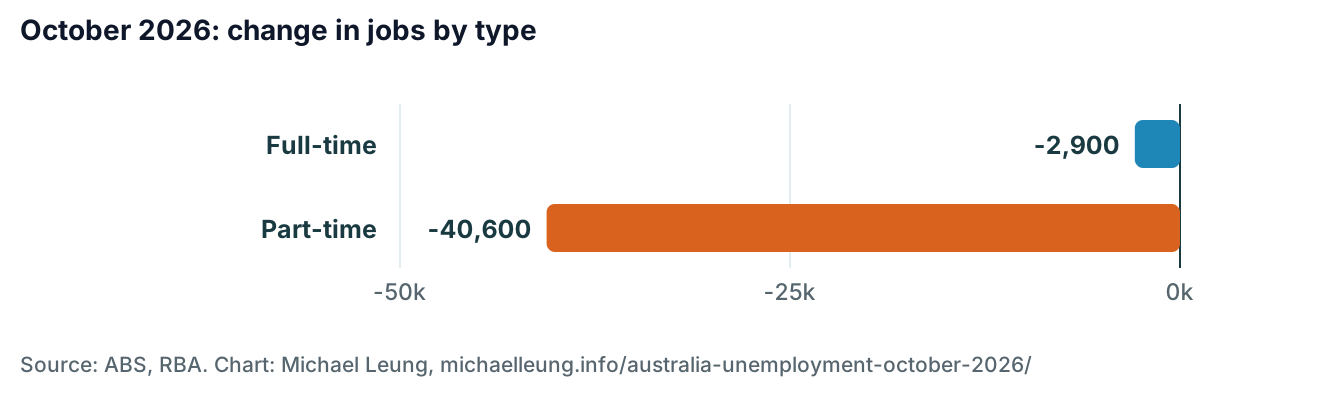
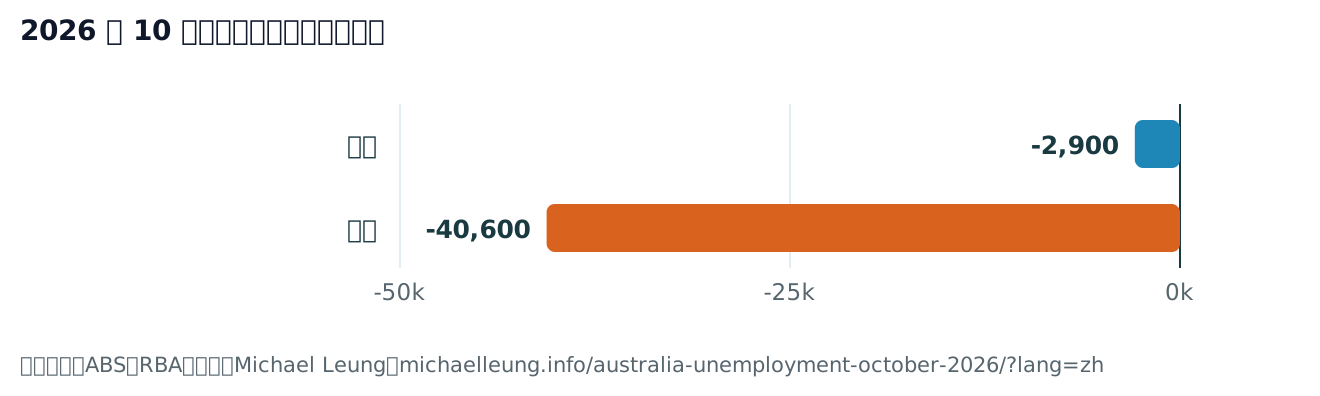
- −43,500 to 14,738,600: full-time −2,900, part-time −40,600
- Unemployed people
- 753,700, up 17,800 in the month and 95,400 over the year
- Hours worked
- −0.2% in the month (about 3.6 million fewer hours); trend +0.1%
- Young people
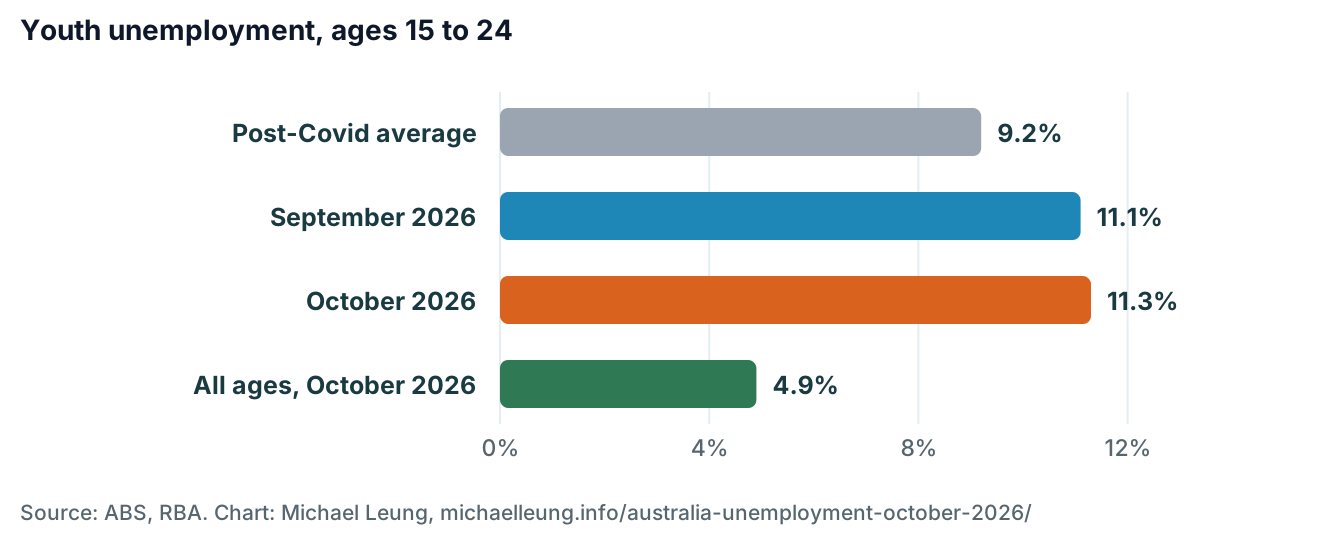
- Ages 15 to 24: 11.3% (September 11.1%), the highest since October 2021
- Participation
- 66.6%, down 0.2 points. Underemployment eased to 6.2%.
- Queensland
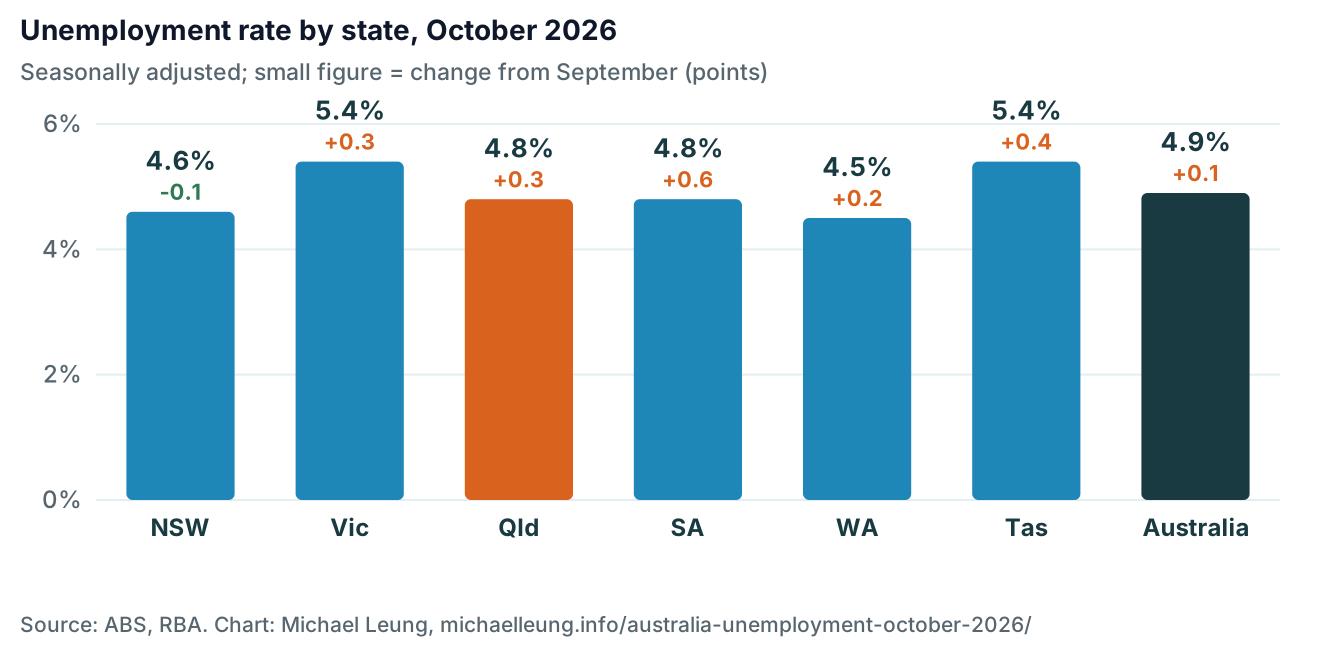
- 4.8%, up 0.3 points; Victoria and Tasmania highest at 5.4%
- RBA
- It forecast 4.7% for the December quarter. October is already at the level it expected for late 2027. Next decision: 8 December.
Useful already? ☕ Buy me a coffee and keep these explainers free and ad-free.覺得有用?☕ 請我喝杯咖啡,讓這些解說繼續免費、無廣告。
What happened to unemployment in October 2026?
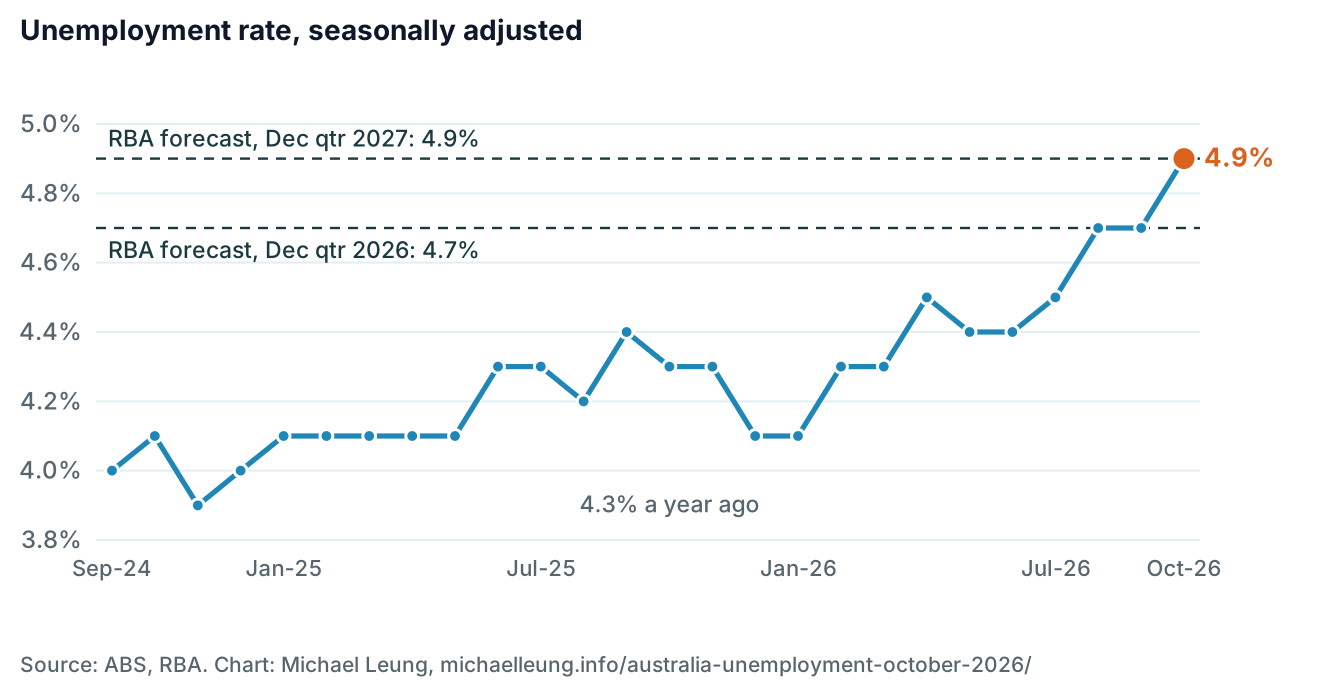
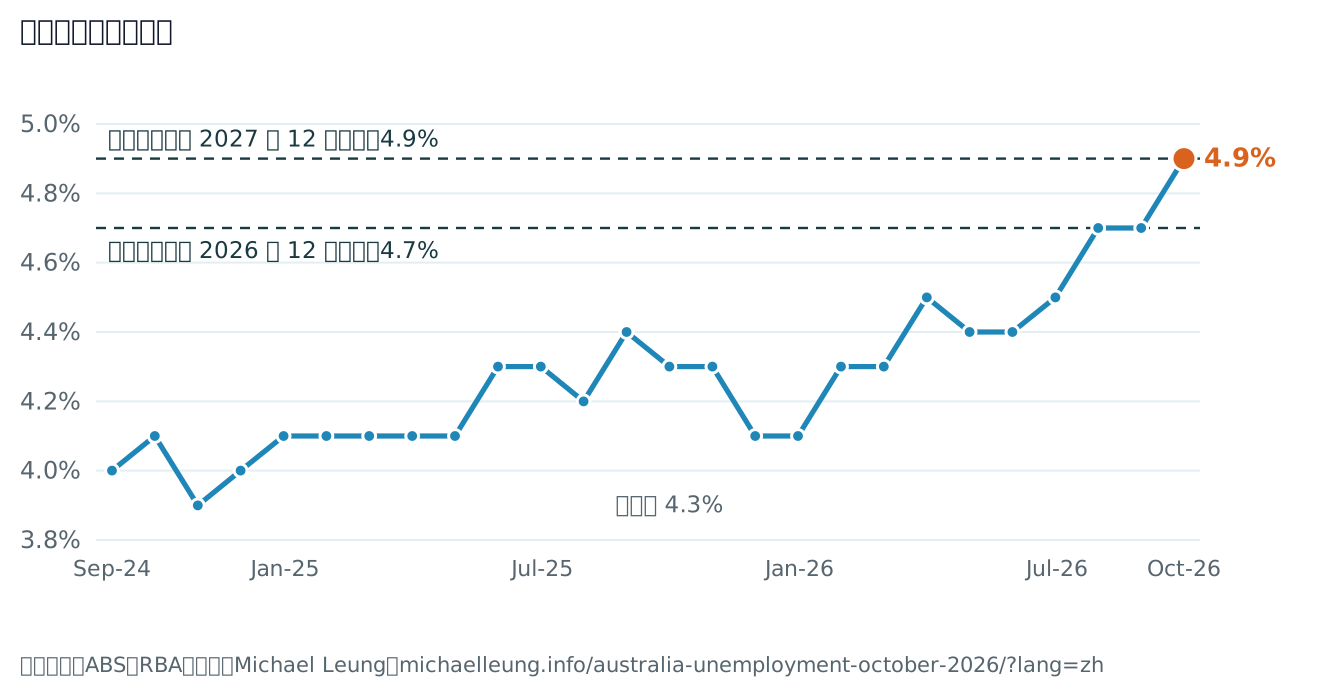
Unemployment rate, seasonally adjusted, September 2024 to October 2026, with the RBA’s November 2026 forecasts for the December quarters of 2026 and 2027. Sources: ABS Labour Force, September and October 2026; RBA Statement on Monetary Policy, November 2026.
The chart shows the shape of it. Through 2025 the rate drifted between 4.1% and 4.4%. In 2026 it has stepped up: 4.5% in April, 4.7% in August and September, 4.9% now. That is the same slow, steady loosening I described in part 11, only a little faster.
The two dashed lines are the RBA’s own forecasts from its November Statement on Monetary Policy, published only three weeks ago. It expected 4.7% for the December quarter and 4.9% for the end of 2027. October has already reached the 2027 number. One month does not make a quarter, but it does tell you the RBA’s forecast was too gentle.
Is this a trend or one bad month?
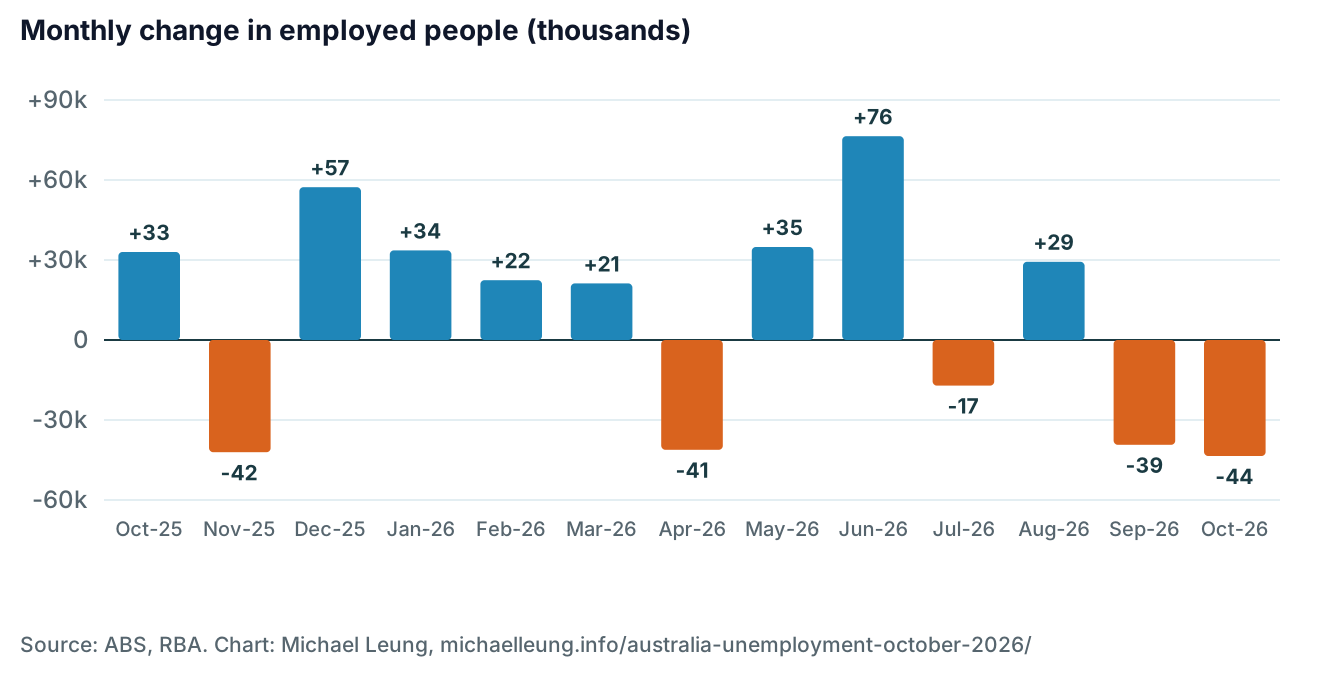
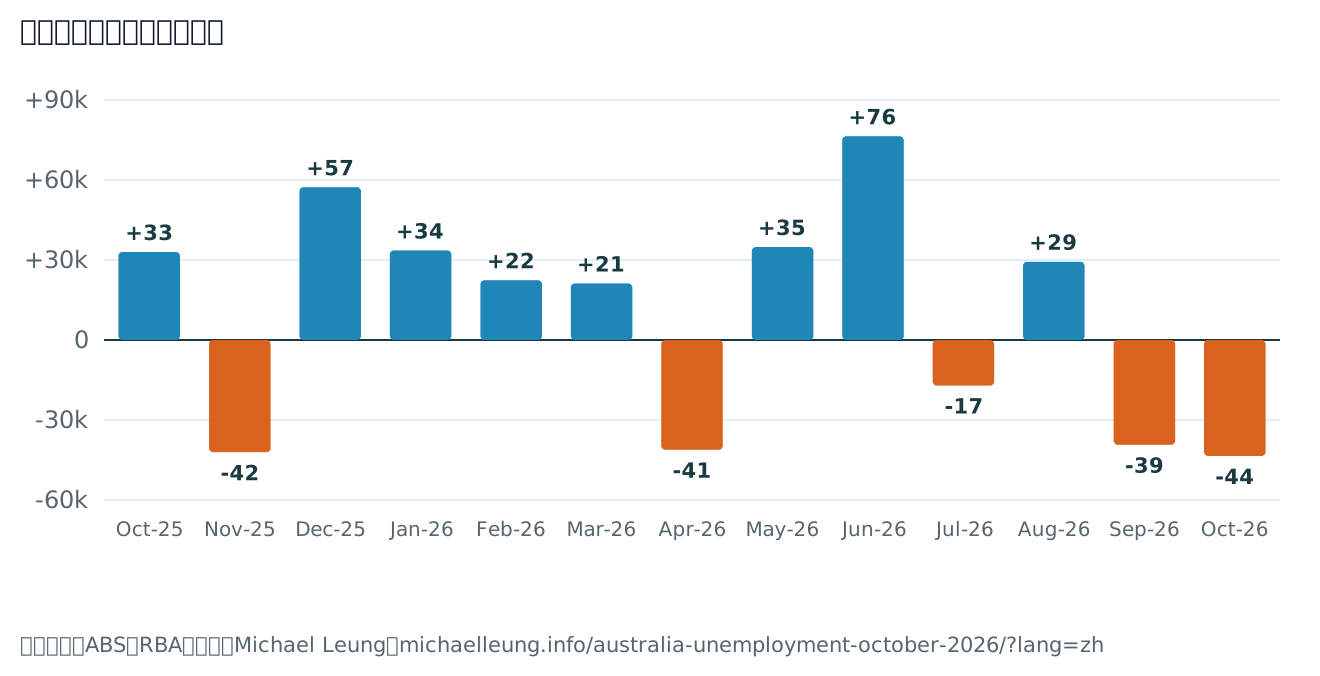
Monthly job numbers jump around. The chart shows four months in the past year with a loss of about 40,000 jobs: November 2025, April 2026, September and October. The first two bounced back the next month. What is new is two big falls in a row, a total of 82,800 jobs in September and October.
Monthly change in employed people, seasonally adjusted, October 2025 to October 2026 (thousands), as published each month. Sources: ABS Labour Force, September and October 2026.
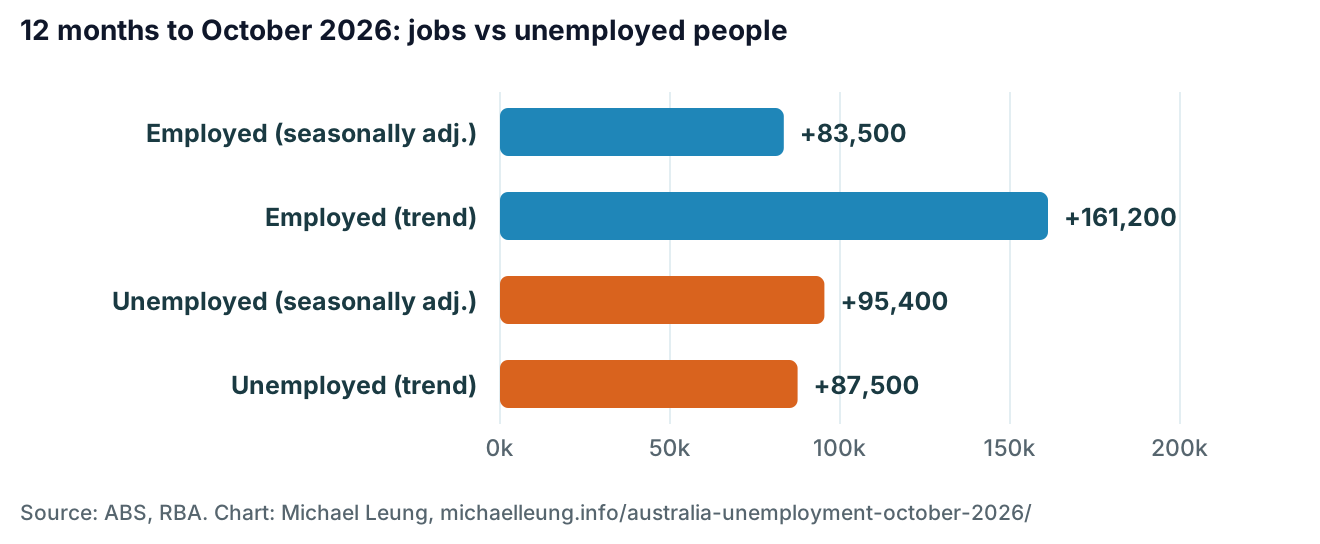
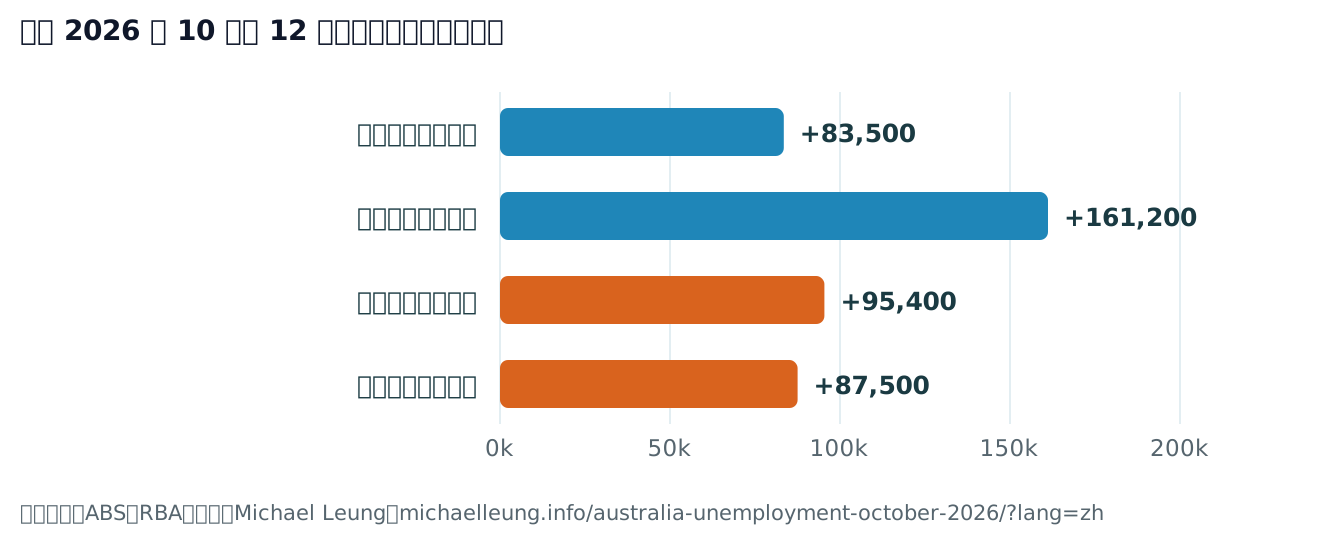
The trend series tells a calmer story. Trend employment rose by 7,200 in October, so it is flat rather than falling, and trend hours rose 0.1%. Over twelve months, trend employment is up 161,200, about twice the seasonally adjusted figure of 83,500.
The number that worries me is the other one. Over the year, 95,400 more people are unemployed, more than the 83,500 extra jobs in the seasonally adjusted data. Even on the trend measure, unemployment grew by 87,500. Jobs are still being created, just not fast enough for a growing population.
Change over the 12 months to October 2026 in employed and unemployed people, seasonally adjusted and trend. Source: ABS Labour Force, October 2026.
The ABS also flagged two sample issues. In South Australia, the group of households that joined the survey in October had a higher unemployment rate than the others, and SA’s rate jumped 0.6 points. In Victoria, it reduced the weight of about 1,390 respondents, around 2.7% of the sample. Neither changes the direction, but both are reasons not to read too much into a single month.

Illustration generated with Qwen Image 2.1
Why did part-time jobs fall so much?
Monthly change in full-time and part-time employment, October 2026, seasonally adjusted. Source: ABS Labour Force, October 2026.
When trade slows, a business rarely sacks its full-time staff first. It trims shifts, stops replacing casuals who leave and holds off on new hires. That fits the rest of the data: hours worked fell 0.2% in the month, while full-time employment barely moved.
There is a twist. Underemployment, people with a job who want more hours, actually fell to 6.2%, and participation dropped 0.2 points to 66.6%. My reading is that some people who lost part-time work stopped looking altogether, or were students and second earners who stepped out of the workforce. That keeps the unemployment rate lower than it would otherwise be. It is not a sign of strength.

Illustration generated with Qwen Image 2.1
How bad is it for young people?
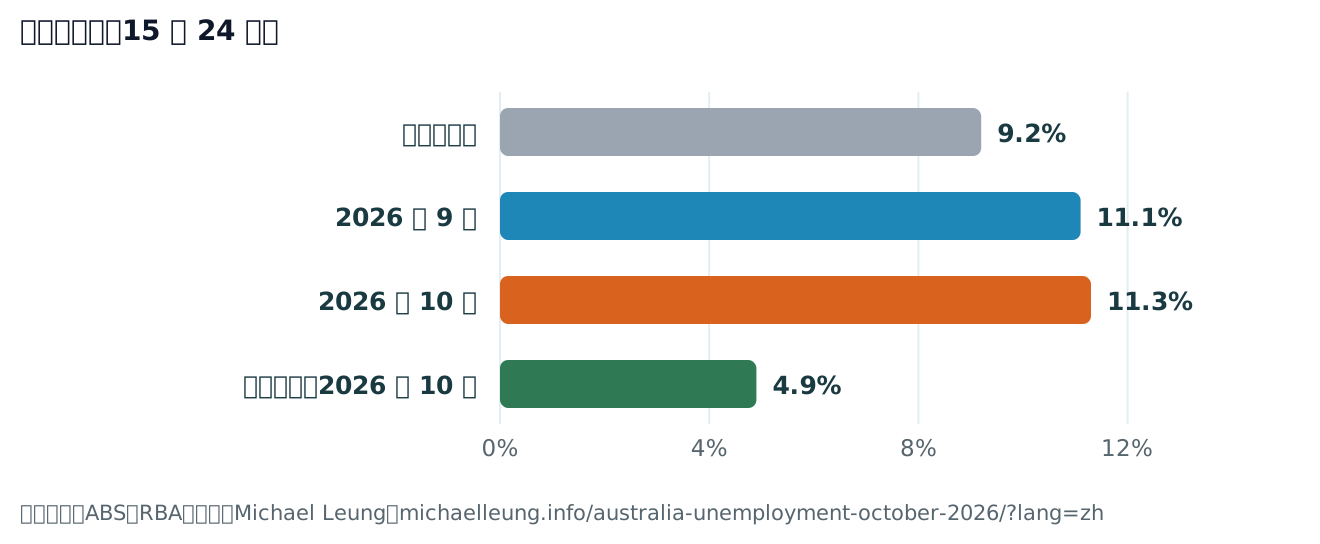
Unemployment rate for people aged 15 to 24, seasonally adjusted, against the post-Covid average (from May 2022) and the overall rate. Source: ABS Labour Force, October 2026.
Young people feel a slowdown first because they hold most of the part-time and casual jobs in retail and hospitality, and because they are the ones trying to get a first job when employers stop hiring. A school leaver or new graduate looking for work this summer faces a lot more competition than one a year ago.
There is a gender gap among adults too: unemployment is 5.0% for men and 4.7% for women. Men are more exposed to construction and manufacturing, which are sensitive to interest rates.

Illustration generated with Qwen Image 2.1
Which states are hit hardest, and how is Queensland doing?
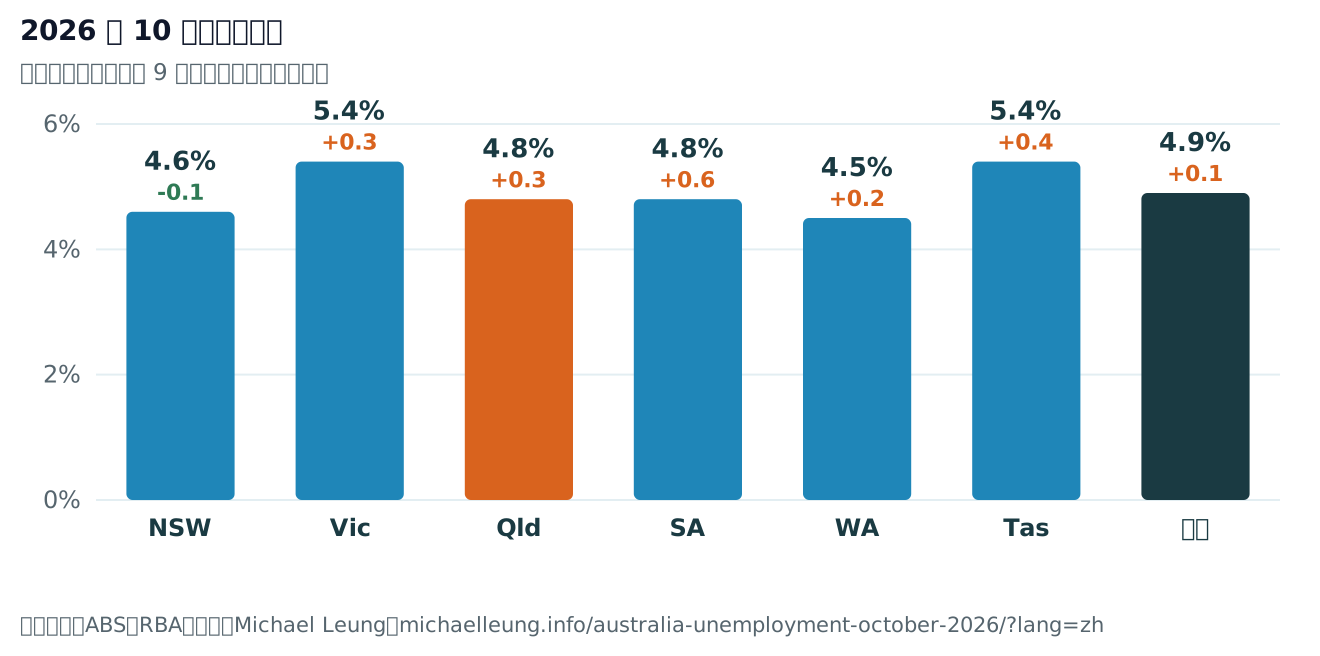
Unemployment rate by state, October 2026, seasonally adjusted, with the change from September in points. The territories have no seasonally adjusted estimate. Source: ABS Labour Force, October 2026.
New South Wales was the only state where unemployment fell, to 4.6%. Western Australia, at 4.5%, is still the lowest, though it lost 1.1% of its jobs in one month, the biggest fall of any state. State figures come from smaller samples and move around even more than the national number, so I would not hang much on any single state in a single month.
For Brisbane readers: Queensland had 3,031,000 people in work, down 0.3% in the month. Its participation rate is still high at 66.8%, but underemployment is 6.8%, above the national 6.2%. In other words, a lot of Queenslanders have work but would like more hours. Construction is still busy, but the rest of the state economy is slowing with the country.
What does this mean for the RBA on 8 December?
The RBA raised the cash rate to 4.85% on 3 November because inflation is too high. It accepted that unemployment would rise as a result, but it expected that rise to be gradual: 4.7% by December and 5.1% by the end of 2028. October’s 4.9% is ahead of that path. A board that voted 6 to 3 last time, with three members already wanting to hold, now has a stronger case to wait.
The other side of the ledger is inflation. The trimmed mean was 3.7% over the year to the September quarter, well above the 2–3% target, and the RBA said some measures of inflation expectations have risen. If the October CPI on 25 November comes in hot, a rise is still possible. That is why I have not gone further than 75%.
These odds are my own judgement, not RBA guidance or market pricing. In part 13 I had a December hold at about 65%; the October jobs figures move me 10 points towards a hold.
What should you do if you are worried about your job?
- Emergency fund. Three months of essential spending is a common target. With the cash rate at 4.85%, money in a mortgage offset account does double duty as that buffer.
- Skills employers are asking for. Practical AI tools, data and digital skills show up in more job ads. A short TAFE or online course costs less than a gap in your CV.
- People, not just job boards. Many roles in Brisbane are filled through contacts before they are advertised. Local business, industry and community events are worth the time.
- If you lose work, check Services Australia early. Waiting periods and income tests apply, so it pays to apply sooner rather than later.
Which dates should you watch?
- 25 November 2026: CPI for October (ABS). The big one for the RBA.
- 8 December 2026: RBA decision, the last of the year
- Mid-December 2026: November jobs figures (check the ABS release calendar)
Show the full data table (October vs September 2026 and a year ago)
| Measure | Oct 2026 | Sep 2026 | Change over a year |
|---|---|---|---|
| Unemployment rate | 4.9% | 4.7% | +0.6 pts |
| Unemployment rate (trend) | 4.8% | 4.7% | +0.5 pts |
| Employed people | 14,738,600 | 14,782,200 | +83,500 (+0.6%) |
| Unemployed people | 753,700 | 735,800 | +95,400 (+14.5%) |
| Participation rate | 66.6% | 66.8% | −0.3 pts |
| Employment-to-population ratio | 63.3% | 63.6% | −0.7 pts |
| Underemployment rate | 6.2% | 6.3% | – |
| Underutilisation rate | 11.1% | 11.1% | – |
| Monthly hours worked | 2,006m | 2,010m | +0.7% |
| Youth unemployment (15–24) | 11.3% | 11.1% | – |
Seasonally adjusted unless stated. Changes over a year as given by the ABS; a dash means the ABS page does not give it. Source: ABS Labour Force, Australia, October 2026.
Download the charts
Every chart on this page is a free SVG file you can open, print or reuse with a link back to this page.
- Unemployment rate, September 2024 to October 2026
- Monthly change in jobs, October 2025 to October 2026
- Jobs and unemployed over 12 months, seasonally adjusted vs trend
- Full-time vs part-time jobs, October 2026
- Youth unemployment, October 2026
- Unemployment by state, October 2026
Common questions
What is Australia’s unemployment rate in October 2026?
4.9% (seasonally adjusted), up from 4.7% in September and the highest since October 2021. The trend rate is 4.8%. The ABS released the figures on 19 November 2026.
How many jobs did Australia lose in October 2026?
Employment fell by 43,500 to 14,738,600. Part-time jobs fell by 40,600 and full-time jobs by 2,900. Over the year, employment is still up 83,500.
What is the youth unemployment rate in Australia?
11.3% in October 2026 for people aged 15 to 24, up from 11.1% in September and the highest since October 2021. The post-Covid average is 9.2%.
What is the unemployment rate in Queensland?
4.8% in October 2026, seasonally adjusted, up 0.3 points from September and below the national rate of 4.9%.
Will the RBA raise rates in December 2026 after the jobs figures?
A rise is less likely. Unemployment is already above the RBA’s forecast for the December quarter. My own view is a hold on 8 December at about 75%, unless the October CPI on 25 November is hot. This is my judgement, not advice.
Is Australia heading for a recession?
The jobs data do not show one yet. Trend employment is flat rather than falling and is still up 161,200 over the year. What the data show is a job market loosening faster than expected, with young people and part-time workers hit first.
Sources
General information only, not financial advice. Research was AI-assisted; every figure was checked against ABS and RBA publications on 22 November 2026. The odds and views on future rates are my own.
Found this useful?
Buy me a coffee ☕
Everything here is free and ad-free. A coffee or a AU$1/month membership keeps new articles, games and tools coming.
Also in the shop:VoidFill · The Architect’s Monologue · Brisbane photo prints
Series: Australian Economy 2026 (part 17 of 17)系列:2026 澳洲經濟(第 17 / 17 篇)
Rates, wages, housing and prices: what the 2026 numbers mean for Australian households.利率、工資、樓價與物價:2026 年的數字對澳洲家庭意味著甚麼。
- Will the RBA Raise Rates? Australia's Jobs and Inflation儲備銀行會加息嗎?澳洲就業與通脹
- RBA Raises the Cash Rate to 4.60%儲備銀行加息至 4.60%
- Wages vs Inflation 2019–2026: CPI +26.8%, WPI +20.8%工資對通脹 2019–2026
- Negative Gearing & CGT Reform: House Prices in Every Capital負扣稅與資本增值稅改革:各首府房價
- Card Surcharge Ban: Who Really Pays Now?禁止刷卡附加費:誰在埋單?
- University vs TAFE: Who Goes Where After Year 12?大學定 TAFE?中學畢業生去向
- Trade Surplus Falls to $495m: Computers, Fuel and Iron Ore貿易順差跌至4.95億:電腦、燃油與鐵礦石
- Bracket Creep: Median Tax Rate 21.6%→25.5%稅級攀升:中位數稅率 21.6%→25.5%
- Medicare Explained: Cover, Costs and LevyMedicare 全解:保障、費用與徵費
- Building Approvals August 2026: Is Australia Building Enough?2026年8月建築審批:澳洲建屋夠快嗎?
- Jobs Fall 39,300: RBA to Hold, Then Hike?就業減少39,300:儲備銀行先按兵不動,再加息?
- CPI Hits 4.3%: Will the RBA Hike on 3 November?通脹升至4.3%:儲備銀行11月3日會加息嗎?
- The RBA Hiked to 4.85%: Why, and What It Costs Your Mortgage儲備銀行加息至4.85%:原因及對供樓的影響
- David Jones Administration: Why a 188-Year-Old Store FellDavid Jones 進入破產管理:188 年老店為何倒下
- Brisbane David Jones After Administration: Packed, Not Empty破產管理後的布里斯本 David Jones:人頭湧湧
- David Jones Collapse: Is Australian Retail Really That Bad?David Jones 倒閉:澳洲零售業真的那麼差?
- Unemployment 4.9%: Is the Job Market Cracking?失業率升至4.9%:就業市場開始崩裂?